A social network caught in the Web by Lada A. Adamic, Orkut Buyukkokten, and Eytan Adar
We present an analysis of Club Nexus, an online community at Stanford University. Through the Nexus site we were able to study a reflection of the real world community structure within the student body. We observed and measured social network phenomena such as the small world effect, clustering, and the strength of weak ties. Using the rich profile data provided by the users we were able to deduce the attributes contributing to the formation of friendships, and to determine how the similarity of users decays as the distance between them in the network increases. In addition, we found correlations between users' personalities and their other attributes, as well as interesting correspondences between how users perceive themselves and how they are perceived by others.Contents
Introduction
User registration and data
Network analysis
Properties of individual profiles
Association by similarity
Similarity and distance
Nexus Karma
Conclusions and future work
Introduction
Community Web sites are becoming increasingly popular — allowing users to chat, organize events, share opinions and photographs, make announcements, and meet new friends. Several prior studies have focused on characterizing these online interactions (Curtis, 1992; Yee, 2001), and others have attempted to measure the effect of the Internet on real life social interactions (Wellman et al., 2002a and 2002b). Our study has a somewhat different focus: While we can learn much about the online community itself, we are more interested in gleaning from it insights about the underlying real world social networks.
The community we chose for our study is Club Nexus. Club Nexus was introduced at Stanford in the fall of 2001. It is a system devised by students to serve the communication needs of the Stanford online community. Students can use Club Nexus to send e-mail and invitations, chat, post events, buy and sell used goods, search for people with similar interests, place personals, display their artwork or post editorial columns. Within a few months of its introduction, Club Nexus attracted over 2,000 undergraduates and graduates, together comprising more than 10 percent of the total student population.
The electronic nature of online community participation presents an opportunity to study human behavior and interactions with great detail and on an unprecedented scale. Traditional methods of gathering information on social networks require researchers to conduct time consuming and expensive mail, phone, or live surveys. This limits the size of the data sets and requires additional time and effort on the part of the participants. When studying an online community, our ability to learn more about the social network is simply a side effect of users transmitting information digitally.
Previously we were able to analyze a portion of the Stanford social network reflected in the homepages of Stanford students and the hyperlinks between them (Adamic and Adar, in press). Our finding that personal homepages can create a large social network was an inspiration for Club Nexus. Because users are explicitly asked to name their friends, Club Nexus is more densely connected than the homepage network where users link to their friends of their own accord. The structured format of the profiles lends itself to easier statistical analysis than the free-form text of personal homepages. The data presents an opportunity to study, among other things, the online community's structure, social interactions and how factors such as personality and interests influence one's choice of friends. In this paper we take the first step of analyzing the community as a social network, and compare profiles supplied by the users to characterize connections.
User registration and data
Upon registering, users entered their names, e-mail addresses, birthdays (for birthday reminder notifications to their friends), major, graduate or undergraduate status, year in school, residence, and home country and state. They could also optionally list the high school (and college if they are graduate students) that they attended, as well as their phone number, hometown, homepage and picture. The data that we used in all of our analysis was anonymized, with user names replaced by unique ID's and only year, graduate or undergraduate status, and department retained from the above information. All results of our study are presented in aggregate to further ensure the users' privacy.
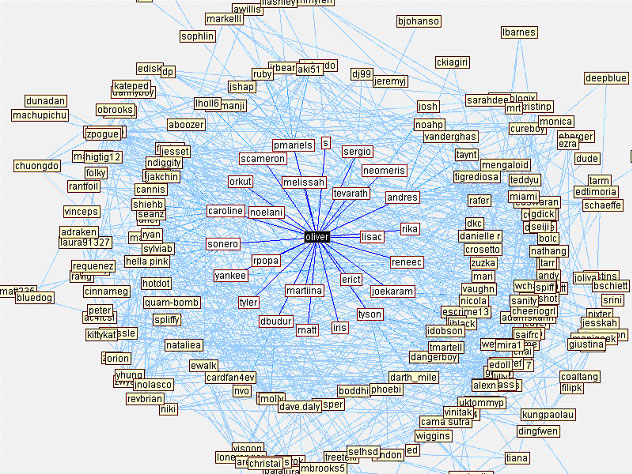
Figure 1: Nexus Net as seen from a single user perspective. Clicking on any of the nodes re-centers the graph around that user.In the second registration step, users were asked to list their friends and acquaintances at Stanford. In 'Nexus-speak' these people are called 'buddies'. Users identified their buddies by searching for them in the Stanford directory or by entering their names manually. If a user adds a buddy who is already registered, the buddy will get a notification that the user has requested to be their buddy and can accept or decline the request. If the 'buddy' is not yet registered, they will get an invitation to join Club Nexus. This viral sign-up strategy resulted in a rapid build-up of the user base. Several months after Club Nexus was introduced, users were given the opportunity to rank how 'trusty', 'nice', 'cool', and 'sexy' their buddies were. This added a new dimension to the interaction data.
In addition to basic demographic information users were asked to add a list of interests and hobbies to their profile by checking off as many choices as they liked from listings of social activities, sports, and movie, music, and book genres. These choices could then be used by Club Nexus to match up users with similar preferences. In a final step, users were asked to select three items from lists of adjectives to describe their personalities, the kinds of people they turn to for support, the ways they like to spend their free time, and what they look for in friendship and romance.
The resulting dataset was a social network with rich profiles for each of the members. In the following sections we first analyze Club Nexus from a network perspective and then look at the relationship between the user attributes and their choices in contacts.
Network analysis
The 'Nexus Net', a large social network, consists of 2,469 Nexus users and 10,119 links between them, two individuals being linked if they include each other on their buddy lists. Users can browse the network using the visual interface shown in Figure 1 and can automatically contact their neighbors out to some radius. For example, to organize an event, they can invite just their friends or their friends' friends.
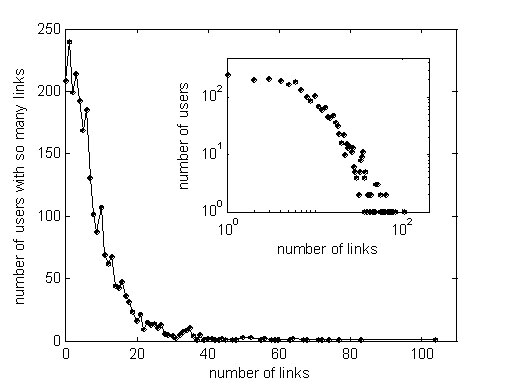
As is typical of both social networks in general and online communities in particular, the number of buddies a user has is distributed highly unevenly. Figure 2 shows that users most frequently listed just one buddy (over 200 listed no buddies), but some individual users had dozens of connections, and one had even exceeded a hundred. Part of the skewness in the connectivity distribution is due to the fact that some people are naturally more social than others, but it also reflects a varying eagerness on the part of users to enter their social contacts into an online service. In general, we expect that most Club Nexus users have more friends offline than just those that they list as their buddies with the service.
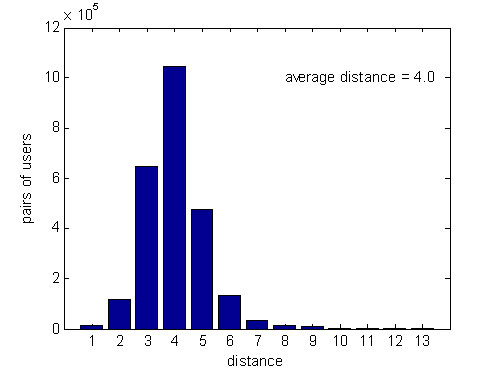
Figure 2: The number of connections users have; a single buddy being the most common case. The inset shows the same distribution on a log-log scale.In analyzing the social network we observed a small world effect (Migram, 1967; Watts and Strogatz, 1998), where the distance between any two users, measured in the number of hops along the Nexus Net, is only four on average (the full distribution is shown in Figure 3). This average might at first seem low in view of the fact that Club Nexus represents a diverse group of users, both undergraduates and graduates at various stages in their studies representing many departments. This is the counterintuitive aspect of the small world phenomenon: individuals tend to socialize in smaller cliques, often determined by factors such as year in school, department or dorm, yet any two users are separated by only a small number of hops. One can determine to what degree cliques are present by measuring the amount of clustering, also sometimes referred to as transitivity (Newman, 2001). The clustering coefficient tells us how many of a user's friends' friends were friends of the user themselves. In the case of Club Nexus the clustering coefficient of 0.17 is 40 times higher than it would be for a random network with the same number of users and connections. This tells us that there is a significant amount of structure in the social interactions reported in Club Nexus. The apparent conflict between clustering and short paths was resolved by Watts and Strogatz (1998). They used a simple model of social networks to show that as long as there is a small fraction of 'random' connections between cliques, social networks could display both high clustering and small average shortest paths.
Figure 3: Distribution of user to user distances, with an average of 4 hops. The average is close to the 3.8 hops of an equivalent random graph with the same number of nodes and edges.While the above analysis of the network topology is insightful, things become even more interesting when user profiles are taken into account. We will explore these profile features in the next section and will later return to their impact on network properties.
Properties of individual profiles
Profile data and statistical tools
In the process of registering users were asked to select three words out of a choice of 10 to 15 describing their personalities, what they look for in friendship and romance, how they spend their free time and what kind of people they turn to for support. All users completed this section as it was required for initial registration. Users were also asked to optionally express their preferences about book and movie genres, indoor, outdoor and water sports, and other activities. The 418 (of the 2,469) users who did not make a selection in any category were omitted from the analysis regarding preferences.
We used Z-scores to characterize the relationships between different attributes the users chose. Z-scores indicate how likely it is to find a connection between two attributes by chance. Specifically, the probability that a Z-score falls above 2 or below -2 is five percent. So we can say that any correlation with an absolute Z-score greater than 2 is significant at the p = .05 level. For example, if we are interested in whether people who consider themselves funny enjoy watching comedies, we count the number of people (518 in all) who selected 'funny' as one of the three descriptive words for themselves. We then count the number of users (1,511 out of 2,051 that specified their interests) who selected comedies as a movie genre they liked. This gives a probability p = 0.74 that a randomly chosen user likes comedies. It then follows that of the 518 'funny' users, an expected p*518 = 382 would enjoy comedies with a standard deviation of 10. We observe that in actuality, 416 users who think they are 'funny' also enjoy comedies. This gives us a Z score of ((number observed)-(number expected))/(standard deviation) = 3.43. The probability that this occurs by chance, that is, that there is no connection between whether users consider themselves funny and whether they like comedies is 0.0003. Hence, although the difference is slight (about 10 percent more funny users like comedies than one would expect from a random sample), the effect is significant. From here on, when we write that 'users possessing quality A tend to like B', we simply mean that the proportion of users having A and liking B is significantly different than the proportion of users overall who like B. In no way do we mean to say that all users having A are a certain way. Wherever practical, we've included the difference between observed and expected quantities in the tabulated results in the appendices. We would also like to remind the reader that the results pertain only to this particular online community, which is not necessarily representative of the population overall.
Personality and preferences
We used this kind of analysis to find correlations between users' personalities and their preferences. Due to the large number of pairings of personality and preference, a few of the relationships may be found statistically significant by chance. But since so many pairings were found to be statistically significant, a majority of them represent true tendencies that paint reasonable portraits of personality types.
Using this technique we found that users tended to be consistent in how they described themselves and what they looked for in others. For example, those who described themselves as sexy were more likely to look for sex in both friendship and romance. Those who described themselves as attractive thought appearance and looks were important. Those who thought themselves to be funny sought laughter both in friendship and romance.
Statistical correlations between personalities and preferences aligned for the most part with stereotypes pertaining to those personalities. Individuals labeling themselves as 'weird' tended to have 'weird' friends and were more likely to prefer spending their free time alone and staying at home, not 'doing anything exciting' or 'doing physically challenging activities'. They are more likely to enjoy science fiction and fantasy books and movies, heavy metal, and computer gaming. They don't especially value looks in relationships and don't tend to describe themselves as fun, attractive or successful.
On the other hand, those who described themselves as 'successful' spent their free time fulfilling commitments and catching up on chores. They also placed an emphasis on appearance and sex in romantic relationships and friendships and liked to spend their time doing physically challenging activities, including weightlifting, tennis, boating, jet and water skiing. They are also three times more likely to read business books.
For a complete list of all significant relationships between personality and preferences the reader may consult Appendix A. The Appendix also lists some interesting correlations that appear between an absence of a characteristic and the person's choices. For example, those users who did not select the word 'responsible' to describe themselves include individuals who enjoy books on sex, erotic, gay and lesbian, and independent movies, listen to funk, jungle, reggae, and trance, and enjoy skateboarding and raving.
Academic Major and Personality
We also examined the relationship between a person's academic major or department and what adjectives (three from a list of sixteen) they selected to describe themselves. Because there are many different majors, the data were spread out thinly. We were still able to glean a few statistically significant trends, shown in Table 1. Physics, math, and electrical engineering majors stayed true to a 'nerdy' stereotype, being approximately twice as likely to spend their free time learning and to describe themselves as 'weird'.
Table 1: Personality traits and positive correlations to majors.
personality (percent of total) major free time learning (17%) Physics (46%), Philosophy (37%), Math (31%), Electrical Engineering (26%), and Computer Science (24%) reading (26%) English (55%) staying at home (8%) History (24%) doing anything exciting (52%) undecided/undeclared (62%) fulfilling commitments (16%) Psychology (27%) watching TV (17%) International Relations (26%) you intelligent (32%) Philosophy (59%) and Computer Science (42%) successful (4%) Computer Science (7%) socially adaptable (14%) Science, Technology, and Society (46%) attractive (16%) Political Science (29%) and International Relations (25%) lovable (12%) Political Science (24%) kind (25%) Public Policy (45%) weird (12%) Physics (34%), Math (28%), and Electrical Engineering (18%) fun (26%) Human Biology (38%) creative (22%) Product Design (62%) and English (42%) sexy (8%) English (18%)
Thirteen of the 29 Public Policy majors (double the average proportion) described themselves as 'kind', while a high number of the 62 Political Science majors thought they were 'attractive' (29 vs. 16 percent) and 'lovable' (24 vs. 12 percent). Those who had not yet declared a major (presumably freshmen) were most amiable to 'doing anything exciting' (209 out of 337). On the other hand, the 46 history majors were three times as likely to enjoy spending their free time at home. Unsurprisingly, the 74 English majors were twice as likely to enjoy spending their free time reading and to consider themselves 'creative'. They were also twice as likely to describe themselves as 'sexy' (18 percent), while on the other hand, only three of the 136 Electrical Engineering majors chose to describe themselves in that way.
Gender Differences
We next examined how gender influences personality and preferences. While most differences were slight (as shown in Appendix B), typically in the range of 5-10 percent, some were quite marked such as the fact that twice as many women as men liked to read romance novels. Although one cannot say that all women or all men are a certain way, for the most part these slight tendencies conformed to existing stereotypes of gender differences.
More men than women enjoy computer, science fiction, professional, technical, science, and business books. More women than men enjoy romance novels, fiction, books about health, mind and body, cooking and art and photography. More men favor football, frisbee golf, table tennis, and golf, while more women prefer gymnastics, field hockey, and softball. More men enjoy science fiction, war, and action movies, as opposed to the romance, family and drama movies women like to watch. More men indicated that they like to spend their free time learning and doing physically challenging activities, while more women said that they like to catch up on chores and socialize. Men preferred friends with mutual acquaintances and common interests, while women valued laughter, honesty and trust. Women looked for the same characteristics in romantic partners, but men were more likely than women to appreciate appearance, sex, and physical attraction. When turning to someone for support, some men gravitated to extremes, turning to 'eternal optimists' or the 'give-it-to-you-straight' people. Women sought support of a more emotional kind and turned to the 'unconditional accepters' and the 'listeners'. Finally, more men than women described themselves as intelligent, while more women than men thought they were fun, lovable and friendly. This may be more indicative of the men's propensity to boast than true intelligence, because there is no confirmed relationship between overall intelligence and gender (Halpern, 2000).
Association by similarity
Many studies have confirmed the tendency of people to share common interests with their social contacts (Lazarsfeld and Merton, 1954; Touhey, 1974; Feld, 1981). We took advantage of the richness of the Club Nexus dataset to see what common interests or traits most influenced friendship. To this end, we used a quantity we termed 'association ratio' to measure network homophily. For a given trait, the association ratio is the proportion of contacts made between people sharing a trait to the proportion of individuals in the population possessing the trait. For example, 329 or 16 percent of the users indicated that they liked ballroom dancing and they had 2,727 buddy links. If one's selection of friends were independent of their enjoyment of ballroom dancing, then 16 percent or 437 of the links would be to other ballroom dancers. However, a full 704 of the links stay within the group of ballroom dancers. This gives us a ratio of 1.61 as the strength of association between ballroom dancers. We also calculate a Z score to confirm that the ratio is not likely to have occurred by chance.
Nearly all interests showed a statistically significant tendency of those individuals sharing them to associate with one another (for detailed results see Appendix C). We found further that, in general, activities or interests that are shared by a smaller subset of people showed stronger association ratios than very generic activities or interests that could be enjoyed by many. For example, raving (1.64), ballroom dancing (1.61), and Latin dancing (1.49) showed stronger association in the social activity category than barbecuing (1.20), partying (1.18), or camping (1.11), although all had very high Z-scores. In sports in particular, multi-player team or niche sports were better predictors of social contacts than sports that could be pursued individually or casually. Among water sports, synchronized swimming, diving, crew, and wake boarding were better predictors than boating, fishing, swimming or windsurfing. In the land sports category, team sports, in particular women's team sports such as lacrosse and field hockey were better predictors than soccer (often played casually as opposed to in a competitive college team), tennis, or racquetball. In the 'other sport' category, niche or extreme sports such as freestyle biking, skateboarding, freestyle frisbee, ultimate frisbee, and sky diving are more predictive than sports that have wider appeal such as backpacking, weightlifting, aerobics, jogging, hiking, snow skiing, martial arts, or bicycling.
We observed that niche book, movie, and music genres were more predictive of friendship than generic ones. Gay and lesbian books, read by 63 users, had a ratio of 4.37, followed by professional and technical, teen, and computer books. In contrast, the general category of 'fiction & literature' had a ratio of 1.09.
Specific movie genres such as gay and lesbian, performing arts, religion and erotic & softcore had higher scores than genres that appeal to a wider audience such as action, drama, mystery, documentary or comedy. Non-mainstream music genres like gospel, jungle, bluegrass/rural and heavy metal were more predictive than jazz, pop, classical and rock.
We also checked for homophily in the users' self-described personalities (see Appendix D). Users who described themselves as 'sexy', 'talented', 'fun', 'weird', or 'lovable' liked to associate with those who described themselves likewise. We know from the previous analysis that those who describe themselves as 'sexy' are more likely to value sex in friendships and romance. It makes sense therefore that they would like to associate with other sexy people. We did not, however, observe homophily for individuals who described themselves as 'intelligent', 'responsible', 'kind', 'competent' and 'successful'. Unsurprisingly, those who like to spend their free time fulfilling commitments and socializing preferentially associate with others who like to do the same. In contrast, users who like to stay at home or be alone do not preferentially associate with other loners.
One observation we made concerning the relationship between a users' profile and their social network is that listing more preferences and interests correlates slightly (r = 0.2) to the number of buddies listed with Club Nexus. There are two possible explanations: 1) Users who invested the time to enter their friends into the database would also take the time to list more of their interests and activities; and, 2) More active users also maintain more social contacts. Unfortunately, the manner in which the data were collected does not allow us to differentiate between the two.
Finally, we were able to use the user's profiles and their positions in the network to test the weak link hypothesis (Granovetter, 1973). It states that connections between dissimilar individuals are important in creating cross-community links. We calculated the betweenness of an edge: how many shortest paths pass through it (Freeman, 1977; Wasserman and Faust, 1994). We then compared the betweenness of the edge to how similar the two individuals sharing the edge were, based on the overlap of their profiles. We found a negative correlation coefficient r = -0.2, meaning that interactions between dissimilar people play a role in making the average distance between any two users in the community shorter. One should also not underestimate the role of highly connected individuals. There is a very strong correlation (r = 0.77) between the betweenness of an individual and the number of buddies they have. Users with many friends naturally serve as a social bridge, and their friends are less likely to all form one social clique, which is indicated by a negative correlation (r = -0.12) between an individual's betweenness score and the clustering coefficient for their friends.
Similarity and distance
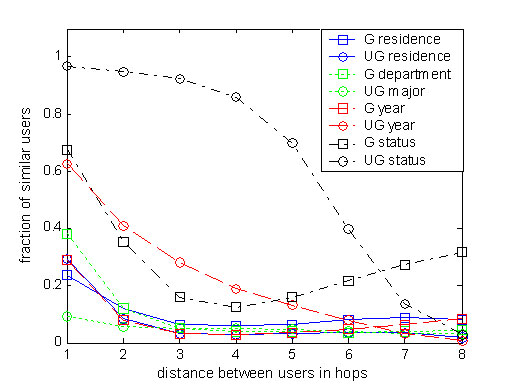
So far we have established that people who share interests or characteristics are more likely to be friends than those who don't. We take this a step further by examining how similar people are on average to each other as a function of their separation in the Nexus Net. In Figure 4 we compare what fraction of an individuals' first, second, third, fourth, etc. neighbors share the same attribute such as department and year in school as the individual. We find that the similarity drops off rapidly for most categories, that is, there is a much higher likelihood that we share a characteristic with a friend or a friend's friend than that we share it with someone four steps removed.
Specifically, we find that the year of study is much more important for undergraduate students than for graduate students, but that the department is more important for graduates than a major is for undergraduates. This can be explained by the observation that undergraduate students take many required classes with others in their class, but graduate students usually spend most of their time interacting with individuals in their research group and sometimes collaborate with others in their department. The courses that they take tend to be more specialized and will usually expose them primarily to other graduate students in their own field. Finally, we find that attributes such as tastes in books and movies also show a decay in similarity with increasing distance in the network. The effect is much smaller, possibly because these variables do not influence to the same extent how and with whom students spend their time.
Nexus Karma
Several months after Club Nexus was launched, Nexus Karma was announced by e-mail as a new feature. Users were given the opportunity to rank how 'trusty', 'nice', 'cool', and 'sexy' their buddies were on a scale of 1 to 4. One could not pick and choose which buddies to rank, but rather had to rank all of them at once. After a week, users who had been ranked by at least three buddies were themselves sent an e-mail asking them to rank their buddies in turn. There was a tremendous response to this, with 446 users ranking 1,735 different friends. This data allowed us to step beyond users' self-perceptions and allowed us to integrate users' perceptions of each other into the network data.
Figure 4: Average fraction of users with a common trait (year, undergraduate or graduate status, etc.) as a function of the distance from a user having that trait. The plot is truncated at eight hops because less than .03% of the pairs are separated by more than eight hops.We found that users had a tendency to give a similar score to a buddy across all categories. That is, users tended to rank their friends as '3, 3, 3, 3' as opposed to '1, 4, 2, 3'. This resulted in a high correlation coefficient between the different attributes. There were still, however, perceptible differences in the scores given. Users on average received the highest scores for niceness (3.37) and trustiness (3.22), followed by coolness (3.13) and sexiness (2.83). While pairs of dissimilar attributes such as 'trusty-sexy' or 'nice-sexy' had a lower correlation coefficient of 0.4, the pairs of attributes 'trusty-nice' and 'cool-sexy' had higher correlation coefficients of 0.7. This indicates that although users had an overall opinion about their buddies, they tended to associate trustiness with niceness and coolness with sexiness.
We found mild or negligible correlation between a person's average ranking in each category and the number of buddies that they have. This negates the hypothesis that people perceived as cool or nice have more friends. Interestingly, we found a slight negative relationship (r ~ -0.1) between the number of buddies a person has and the average 'trusty', 'nice', and 'cool' scores that they gave them. A simple interpretation is that those who list only a few of their friends with Club Nexus tend to list their closest ones, those they would rate most highly. Users who list a large number of friends are more likely to include those that they don't have the highest opinion of.
We did find interesting correlations between the ratings users received from others and the adjectives that they chose to describe themselves. We used a t test for two sample means to see if the average ranking in a category differed at the one percent significance level between those who did and did not choose a particular adjective to describe themselves. A few adjectives displayed a slight, but significant, difference. For example, those who described themselves as responsible received higher (3.36 on average vs. 3.23 for those not describing themselves as responsible) 'trusty' scores on average, but scored slightly lower in the 'cool' (3.02 vs. 3.13) and 'sexy' (2.67 vs. 2.85) categories. The reverse was true of those who described themselves as 'attractive' or 'sexy'. They were ranked more highly on average in the 'sexy' category, but fared worse in the 'trusty' and 'nice' categories. As one would expect, 'friendly' and 'kind' users received higher scores in the 'nice' category, while 'kind' people were also ranked as more 'trusty'. Users who described themselves as 'weird' received lower 'sexy' scores, while 'funny' people were perceived as less 'nice'. This not only demonstrates a clear correspondence between the way that individuals perceive themselves and the way that they are perceived by others, but also an interesting dichotomy between desirable qualities such being funny or attractive and whether people possessing those qualities are perceived as nice.
We were also interested in the reasons why individuals gave the rankings that they did. One might expect that nicer people are more generous with their judgments. Indeed, the higher a user's 'nice' score, the higher the 'trusty', 'nice', and 'cool' scores (r = 0.14-0.17) they give to their friends. Similarly, the higher a user's 'trusty' score, the higher the 'trusty', 'nice', 'cool', and 'sexy' scores that user gives to others (r = 0.14-0.20). We also found evidence that some friendships are closer than others. For example, users who share friends (and hence belong to the same clique) are more likely to give each other high scores (r = 0.10-0.13). We further found that users tend to reciprocate their 'trusty' and 'nice' scores, meaning that if user A gives user B a higher than average score, then user B is somewhat more likely to do the same for user A. Note that users' ratings of one another are independent because they are not told, except in aggregate, what score their friends have given them. Users did not however seem to reciprocate on their 'cool' and 'sexy' opinions.
These are only some of the insights that can be gleaned from the Nexus Karma data set. We hope to study it in greater detail in future work.
Conclusions and future work
We have presented a preliminary social network analysis of the Club Nexus online community. The online community in many respects appears to reflect the underlying community structure at Stanford University. The size of the network allowed us to study phenomena such as the small world effect and the strength of weak ties, while the richness of the profiles allowed us to characterize social ties and identify what factors influence friendships.
Our analysis was able to detect many expected trends (e.g. English majors liking to spend their free time reading or people sharing a narrow or unusual interest becoming friends), while at the same time finding non-obvious relationships (e.g. 'responsible' people being perceived as slightly less 'cool'). What makes Club Nexus special is that one is able to observe these patterns on a large scale with many different variables. The richness of this information can be used to model dynamics such as the spread of ideas on a network or the way that people can find each other through their contacts. The ranking data from Nexus Karma can help us better understand reputation mechanisms now used by online retailers (Resnick and Zeckhauser, 2002).
As the Club Nexus community evolves, there will be opportunity to study the changes in the network over time, as well as to analyze social dynamics such as the adoption of a new feature introduced at the Web site. Whereas tracking social networks over time by traditional methods such as telephone or live interviews is very expensive and time consuming, studying online communities is relatively effortless but may provide new and valuable insights.
About the Authors
Lada Adamic is a researcher in the Information Dynamics Group at Hewlett-Packard Labs in Palo Alto, Calif.
Orkut Buyukkokten is a researcher at Google Labs in Mountain View, Calif. During the last year of his PhD in Computer Science at Stanford he helped create Club Nexus, the online community that is the subject of this paper. He also co-founded Affinity Engines, a company that helps organizations build online communities.
Eytan Adar is a researcher in the Information Dynamics Group at Hewlett-Packard Labs in Palo Alto, Calif.
Acknowledgments
We would like to thank Rajan Lukose, Mette Huberman, T.J. Giuli, and Kresimir Adamic for their valuable comments.
References
L.A. Adamic and E. Adar, in press. "Friends and neighbors on the Web," Social Networks.
P. Curtis, 1992. "Mudding: Social phenomena in text-based virtual realities," In: Proceedings of the 1992 Conference on the Directions and Implications of Advanced Computing, Berkeley, Calif. (May).
S.L. Feld, 1981. "The focused organization of social ties," American Journal of Sociology, volume 86, number 5 (March) pp. 1015-1035.
L.C. Freeman, 1977. "A set of measures of centrality based upon betweenness," Sociometry, volume 40, number 1 (March), pp. 35-41.
M. Granovetter, 1973. "The strength of weak ties," American Journal of Sociology, volume 78, number 6 (May), pp. 1360-1380.
D.F. Halpern, 2000. Sex differences in cognitive abilities. Mahwah, N.J.: Lawrence Erlbaum.
P. Lazarsfeld and R.K. Merton, 1954. "Friendship as a social process: A substantive and methodological analysis," In: M. Berger, T. Abel, and C.H. Page (editors). Freedom and control in modern society. New York: Van Nostrand, pp. 18-66.
M.E.J. Newman, S.H. Strogatz, and D.J. Watts, 2001, "Random graphs with arbitrary degree distributions and their applications," Physical Review E, Third Series, volume 64, parts 1 and 2 (August), 026118.
P. Resnick and R. Zeckhauser, 2002. "Trust among strangers in Internet transactions: Empirical analysis of eBay's reputation system," In: Michael R. Baye (editor). The economics of the Internet and e-commerce. Advances in Applied Microeconomics, volume 11. Amsterdam, Elsevier.
J.C. Touhey, 1974. "Situated identities, attitude similarity, and interpersonal attraction," Sociometry, volume 37, number 3 (September), pp. 363-374.
S. Wasserman and K. Faust, 1994. Social network analysis. Cambridge: Cambridge University Press, pp. 188-191.
D.J. Watts and S.H. Strogatz, 1998. "Collective dynamics of small-world networks," Nature, volume 393, number 6684 (4 June), pp. 440-442.
B. Wellman, A. Quan-Haase, J. Boase, and W. Chen, 2002a. "Examining the Internet in everyday life," Keynote address to the Euricom Conference on e-Democracy, Nijmegen, Netherlands (October).
B. Wellman, J. Boase, and W. Chen, 2002b. "The networked nature of community online and offline," IT & Society, volume 1, number 1 (Summer), pp. 151-165.
N. Yee, 2001. "The Norrathian Scrolls: A study of Everquest," at http://www.nickyee.com/eqt/report.html, accessed 5 February 2003.
Appendix A
Table A1: Correlations between a user's personality and their preferences.
personality preference/activity item
(Z score, number of individuals who selected both the personality trait and the item, the number expected if random)attractive book business (4.34, 48, 26.5) movie erotic & softcore (3.09, 48, 31.5) music disco (3.04, 51, 34.1) other weightlifting (4.64, 102, 67.8) social bar-hopping (5.43, 154, 107.4), clubbing (5.83, 190, 137.3), hip-hop dancing (4.20, 121, 87.2), hot tubbing (5.14, 157, 112.4), partying (5.55, 246, 195.4) watersport crew (3.99, 30, 14.9), diving (3.32, 20, 9.8), jet skiing (3.41, 68, 46.4), scuba diving (3.18, 62, 42.6) creative book art & photography (6.47, 143, 88.7), philosophy (3.42, 120, 91.0), fiction & literature (3.26, 282, 248.6), classics (2.75, 164, 137.4) music folk (4.80, 83, 50.9), bluegrass/rural (3.26, 57, 37.8), jazz (3.16, 164, 133.6) movie art (6.95, 141, 83.8), documentary (2.79, 129, 104.2), independent (5.04, 206, 155.7) not* friendly book philosophy (3.19, 297, 252.1), sex (3.22, 169, 133.9) movie erotic & softcore (2.83, 139, 110.6), independent (2.93, 480, 431.4) music funk (2.93, 194, 159.5) social hot tubbing (3.03, 444, 394.7), raving (2.80, 181, 149.0) fun book entertainment (3.04, 137, 108.8) landsport beach volleyball (2.87, 127, 101.1), football (2.86, 123, 97.5) movie adventure (3.16, 305, 268.8), drama (3.45, 325, 285.7), horror (2.53, 108, 86.5), romance (2.98, 200, 168.2) music rap/hip-hop (4.20, 282, 234.2), soul/R&B (2.60, 193, 165.4) other ice skating (2.69, 100, 78.1) social partying (5.93, 369, 301.8), clubbing (4.99, 268, 211.9), hip-hop dancing (4.43, 179, 134.6), bar-hopping (3.02, 198, 165.9), hot tubbing (2.92, 205, 173.5) watersport surfing (2.78, 68, 49.4), wake boarding (3.31, 54, 35.1), water skiing (2.91, 89, 66.8) funny landsport table tennis (2.51, 153, 128.3) movie comedy (3.43, 416, 381.6) music rap/hip-hop (2.73, 262, 231.1), rock (3.05, 377, 344.2) other bowling (3.04, 179, 147.7), couch potatoing (3.16, 204, 170.2) intelligent book philosophy (2.90, 169, 138.7), politics (2.81, 141, 113.7), science (3.99, 151, 112.4), science fiction (2.88, 213, 180.0) other computer gaming (2.74, 134, 108.0) kind movie science fiction (2.67, 201, 172.3) lovable book cooking (2.53, 38, 25.8), entertainment (3.27, 73, 52.0), romance (2.89, 35, 22.0) movie adventure (2.59, 149, 128.5), mystery (2.92, 93, 72.1), romance (5.63, 122, 80.4) music easy listening (3.13, 48, 31.6), latin (2.81, 71, 52.9), rap/hip-hop (2.80, 134, 112.0), soul/R&B (4.20, 110, 79.1), trip-hop (2.52, 40, 27.5) other aerobics (2.58, 36, 24.0) social hip-hop dancing (4.43, 95, 64.4) watersport swimming (2.82, 121, 99.1) not* responsible book sex (3.88, 149, 110.6) movie erotic & softcore (3.15, 120, 91.3), gay & lesbian (3.11, 55, 36.5), independent (3.70, 412, 356.2) music funk (3.11, 165, 131.7), jungle (3.15, 99, 73.1), reggae (2.87, 199, 165.4), trance (2.86, 231, 195.2) other skateboarding (2.54, 63, 46.2) social raving (4.14, 166, 123.1) sexy book sex (7.71, 51, 19.2), teen (5.26, 19, 6.2), health mind & body (3.06, 29, 17.0) landsport wrestling (3.05, 14, 6.4) movie erotic & softcore (9.80, 53, 15.8), western (4.40, 28, 12.8), gay & lesbian (4.32, 17, 6.3), horror (2.64, 41, 28.2) music funk (4.98, 45, 22.8), house (3.88, 47, 28.2), disco (3.52, 31, 17.2), jungle (3.31, 24, 12.7), trip-hop (2.75, 30, 18.8), reggae (2.73, 42, 28.7) other weightlifting (4.19, 56, 34.1), bungee jumping (3.26, 20, 10.0), skateboarding (2.89, 16, 8.0) social hot tubbing (6.58, 97, 56.5), bar-hopping (4.60, 82, 54.0), raving (4.78, 42, 21.3), partying (4.29, 126, 98.3), hip-hop dancing (3.88, 66, 43.9), folk dancing (3.62, 15, 6.2), clubbing (3.58, 92, 69.0) watersport jet skiing (3.26, 38, 23.3), surfing (2.86, 27, 16.1) not* sexy book science fiction (2.61, 305, 268.5) socially adaptable book sociology (3.41, 39, 23.2) music house (2.75, 65, 47.6), rap/hip-hop (2.97, 154, 128.9) other snowboarding (2.55, 65, 48.8) social bar-hopping (3.63, 120, 91.3), clubbing (2.92, 141, 116.7), raving (2.83, 52, 36.1) watersport water polo (3.56, 23, 11.3) not* socially adaptable movie art (3.01, 185, 151.7), fantasy (2.59, 197, 167.3), performing arts (2.64, 112, 88.6) other laser gaming (2.67, 99, 76.8) successful book business (5.88, 21, 6.6) landsport tennis (3.41, 43, 28.2) other weightlifting (4.16, 32, 16.8) social barbecuing (3.05, 41, 27.8) watersport boating (2.85, 22, 12.7), jet skiing (4.30, 25, 11.5), water skiing (3.05, 20, 10.7) not* successful book fantasy (3.03, 222, 186.0), science fiction (2.66, 246, 212.9) movie art (3.43, 189, 151.2), fantasy (2.74, 198, 166.7), gay & lesbian (2.70, 43, 28.8), performing arts (3.02, 115, 88.3) talented book professional & technical (3.17, 22, 11.6) movie performing arts (4.20, 37, 19.5) other skateboarding (2.87, 16, 8.1) not* talented book fantasy (3.37, 184, 148.2), science fiction (3.01, 203, 169.6) movie art (2.80, 148, 120.4), fantasy (2.96, 163, 132.8), independent (2.79, 257, 223.6) other laser gaming (2.97, 83, 61.0) unique landsport track & field (2.58, 74, 55.9) movie independent (2.52, 191, 165.1) not* unique book science fiction (4.59, 82, 53.4), fantasy (3.75, 69, 46.7) landsport fencing (2.90, 14, 6.7) movie fantasy (3.34, 61, 41.8), art (3.27, 56, 37.9), science fiction (3.05, 84, 64.0) weird book fantasy (3.32, 78, 56.3), science fiction (3.75, 90, 64.4) movie art (3.01, 64, 45.7), fantasy (3.27, 71, 50.4), science fiction (2.90, 98, 77.1) music heavy metal (2.56, 39, 26.6) other computer gaming (3.24, 57, 38.6)
*Note: Personality traits preceded by "not" (for example, "not friendly") do not mean that individuals described themselves as having that trait. Rather, they elected not to select a certain characteristic (e.g. friendly). "Not" simply means the absence of a self-described characteristic.
Appendix B
Table B1: Preferences of male users.
preference/activity item
(Z score, number observed, number expected)book computers (5.74, 172, 113.3), science fiction (5.65, 430, 338.6), professional & technical (4.72, 125, 83.1), science (4.49, 272, 211.5), business (3.85, 133, 96.4), politics (3.33, 259, 213.9), philosophy (3.08, 306, 260.9), sports (3.07, 179, 144.0), adventure (2.35, 337, 300.7) landsport football (5.92, 312, 229.6), frisbee golfing (5.16, 195, 137.4), table tennis (5.00, 384, 306.1), golf (4.72, 258, 196.4), baseball (4.70, 199, 145.2), basketball (4.02, 442, 374.8), cricket (2.88, 54, 36.8), fencing (2.32, 57, 42.2), racquetball (3.67, 94, 65.1), squash (2.32, 82, 63.9), tennis (2.94, 466, 415.1), soccer (2.10, 382, 347.6), wrestling (2.03, 60, 46.4) movie science fiction (7.42, 533, 405.5), war (6.98, 395, 288.6), action (4.03, 771, 693.5), spy film (3.59, 450, 389.2), erotic & softcore (3.26, 148, 114.5), adventure (2.69, 684, 632.6), anime (2.88, 202, 166.9), sports (2.98, 262, 221.1), western (3.02, 121, 92.8) music heavy metal (4.55, 191, 139.8) other computer gaming (7.02, 296, 203.0), weightlifting (5.55, 326, 246.4), billiards (4.57, 432, 356.7), ultimate frisbee (4.53, 246, 188.0), mountain biking (4.51, 175, 126.5), paintballing (4.35, 241, 185.6), laser gaming (2.30, 146, 121.7), bicycling (2.15, 257, 227.1) social barbecuing (3.04, 462, 409.7), raving (2.45, 183, 154.2), hot tubbing (2.06, 444, 408.5) watersport fishing (2.23, 183, 156.7), sailing (2.03, 205, 179.5) personality trait
(Z score, observed, expected)free time learning (4.21, 314, 253.1), doing physical challenging activities (4.07, 414, 347.6) friendship mutual friends (3.51, 217, 173.5), common interests (3.33, 875, 811.0), appearance/look (3.05, 92, 67.5), sex (2.65, 72, 53.0) romance appearance/look (5.09, 293, 222.9), sex (3.41, 239, 194.6), physical attraction (2.93, 686, 630.2) support eternal optimists (3.88, 325, 267.5), give-it-to-you-straight people (3.08, 872, 812.8), I've-been-down-and-dirty-a-few-times-myself people (2.12, 414, 378.4) you intelligent (2.99, 523, 469.4)
Table B2: Preferences of female users.
preference/activity item
(Z score, number observed, number expected)book romance (8.28, 139, 71.5), fiction & literature (5.55, 557, 470.2), health mind & body (4.86, 123, 81.1), cooking (4.35, 122, 83.9), art & photography (4.26, 218, 167.7), entertainment (3.05, 205, 168.9), mystery & thriller (2.99, 209, 173.3), psychology (2.52, 145, 119.2), classics (2.17, 290, 260.0) landsport gymnastics (4.31, 53, 29.8), field hockey (4.08, 35, 17.9), softball (2.70, 84, 63.2) movie romance (11.48, 420, 261.1), family (5.61, 135, 85.5), drama (5.16, 524, 443.6), musical (5.09, 230, 169.7), performing arts (3.54, 125, 92.6), comedy (2.38, 637, 600.6), independent (2.12, 325, 294.5) music soul/R&B (5.39, 331, 256.8), pop (4.49, 442, 373.6), country/western (4.08, 121, 85.1), rap/hip-hop (3.06, 410, 363.7), folk (2.34, 118, 96.2), latin (2.46, 201, 171.7) other aerobics (9.69, 160, 77.9), ice skating (4.93, 172, 121.2), jogging (3.92, 262, 211.5) social hip-hop dancing (6.62, 294, 209.1), latin dancing (3.94, 165, 124.0), clubbing (3.44, 380, 329.1) watersport swimming (2.79, 363, 322.0) personality trait
(Z score, observed, expected)free time catching up on chores and things (3.80, 244, 196.4), socializing (3.75, 715, 659.8) friendship laughter (6.66, 791, 696.4), honesty/trust (3.95, 736, 678.9), communication (2.24, 514, 479.0) romance laughter (7.18, 579, 466.7), honesty/trust (2.92, 685, 641.5) support unconditional accepters (5.99, 355, 271.1), listeners (3.43, 596, 542.6), chicken-soup people (2.95, 156, 125.2) you fun (4.05, 307, 251.6), lovable (2.56, 142, 116.1), friendly (2.53, 446, 407.0)
Appendix C: Individual preferences and association ratios
Table C1: Book genres and association ratios.
genre association ratio Z score number of users number of connections number expected gay & lesbian 4.37 15.35 63 88 20 professional & technical 1.75 6.61 138 128 73 computers 1.65 8.52 188 256 154 teen 1.64 3.04 74 36 22 sex 1.41 6.82 230 340 240 sports 1.39 5.91 239 288 207 business 1.37 4.20 160 162 118 romance 1.32 3.63 180 158 120 religion & spirituality 1.31 5.63 258 376 286 politics 1.31 7.80 355 700 535 art & photography 1.29 9.29 422 1,056 819 sociology 1.28 3.24 165 156 121 fantasy 1.26 9.80 491 1,356 1,075 entertainment 1.26 8.46 425 1,064 845 health, mind & body 1.23 3.11 204 202 164 psychology 1.21 4.69 300 496 408 science 1.21 4.91 351 572 474 cooking 1.20 3.03 211 236 195 science fiction 1.20 8.54 562 1,610 1,343 biography 1.19 4.89 337 630 527 travel 1.17 3.71 306 450 382 nonfiction 1.16 4.79 419 868 750 philosophy 1.15 4.56 433 882 769 mystery & thriller 1.14 4.63 436 968 848 adventure 1.14 5.18 499 1,198 1,051 horror 1.13 1.32 144 102 89 classics 1.13 6.88 654 2,096 1,851 history 1.10 3.62 483 1,068 969 fiction & literature 1.09 11.17 1,183 6,568 6,004 outdoor & nature 0.88 -1.13 140 68 77
Table C2: Movie genres and association ratios.
genre association ratio Z score number of users number of connections number expected gay & lesbian 5.65 24.75 76 154 27 performing arts 1.76 13.22 233 472 268 religion 1.46 2.89 92 54 36 erotic & softcore 1.44 5.57 190 208 144 sports 1.38 9.95 367 760 548 anime 1.37 6.82 277 408 298 musical 1.36 11.66 427 1,154 851 western 1.32 3.33 154 136 103 family 1.26 3.85 215 252 200 fantasy 1.25 8.40 440 1,078 859 art 1.25 7.48 399 898 718 crime 1.24 7.58 421 952 765 independent 1.24 14.70 741 3,056 2,471 biography 1.18 3.12 245 304 257 war 1.17 6.12 479 1,132 965 thriller 1.16 9.82 744 2,850 2,461 romance 1.15 7.49 657 1,984 1,727 history 1.15 4.21 398 754 657 science fiction 1.14 7.52 673 2,192 1,921 horror 1.12 3.08 338 576 512 adventure 1.11 11.20 1,050 5,372 4,828 spy film 1.11 5.62 646 1,974 1,777 action 1.11 12.39 1,151 6,250 5,633 drama 1.10 11.39 1,116 5,996 5,429 mystery 1.08 3.63 589 1,554 1,437 documentary 1.06 2.20 496 1,060 999 comedy 1.05 9.34 1,511 10,002 9,533
Table C3: Music genres and association ratios.
genre association ratio Z score number of users number of connections number expected gospel 2.06 6.76 105 80 38 jungle 1.78 8.67 152 202 113 bluegrass/rural 1.48 5.70 180 188 126 heavy metal 1.48 7.83 232 354 239 trance 1.44 13.92 406 1,158 804 funk 1.42 8.14 274 454 318 latin 1.42 13.71 432 1,212 855 house 1.40 10.08 338 758 543 folk 1.38 6.27 242 332 240 trip-hop 1.33 5.18 225 298 224 soul/R&B 1.31 16.43 646 2,498 1,904 techno 1.30 14.56 588 2,152 1,652 rap/hip-hop 1.30 24.99 915 5,004 3,850 new age 1.30 3.28 157 146 112 easy listening 1.29 5.05 258 344 266 reggae 1.25 6.26 344 640 510 blues 1.23 5.93 348 664 538 country/western 1.23 3.16 214 212 172 disco 1.22 3.15 206 234 192 jazz 1.19 9.70 636 2,124 1,783 world music 1.18 5.01 384 724 612 pop 1.18 15.50 940 4,668 3,951 classical 1.12 6.87 716 2,372 2,116 rock 1.10 15.54 1,363 8,670 7,871
Table C4: Land sports and association ratios.
sport association ratio Z score number of users number of connections number expected touch rugby 33.08 N/A 4 2 0 lacrosse 3.12 7.09 54 34 10 field hockey 2.64 5.00 45 24 9 wrestling 2.29 6.73 77 60 26 cricket 2.24 4.44 61 28 12 fencing 2.14 4.77 70 36 16 frisbee golfing 1.99 16.59 228 494 247 squash 1.79 5.21 106 74 41 track & field 1.72 12.93 251 482 279 gymnastics 1.66 3.55 75 46 27 softball 1.64 6.87 159 176 107 baseball 1.59 9.98 241 400 251 badminton 1.56 8.76 221 336 214 football 1.56 15.50 381 970 621 golf 1.33 7.43 326 582 439 volleyball 1.22 6.18 388 764 624 beach volleyball 1.20 5.71 395 804 670 basketball 1.15 6.95 622 1,758 1,530 table tennis 1.14 5.29 508 1,232 1,081 soccer 1.13 5.53 577 1,506 1,334 tennis 1.05 2.52 689 1,924 1,835 racquetball 0.80 -1.34 108 34 42
Table C5: Water sports and association ratios.
sport association ratio Z score number of users number of connections number expected synchronized swimming 3.25 5.91 45 22 6 diving 2.42 4.72 59 26 10 crew 2.24 6.97 90 68 30 wake boarding 1.64 6.01 137 136 83 jet skiing 1.38 7.28 280 442 320 surfing 1.33 4.16 193 190 142 scuba diving 1.33 5.93 257 376 282 water skiing 1.29 5.10 261 354 274 canoeing 1.24 5.36 309 538 434 water polo 1.18 0.97 80 32 27 sailing 1.13 2.72 298 406 358 kayaking 1.13 2.93 309 472 416 boating 1.10 2.11 309 418 380 swimming 1.08 5.30 810 2,968 2,751 fishing 1.08 1.36 260 294 273 windsurfing 0.87 -1.12 135 56 64
Table C6: Other sports and association ratios.
sport association ratio Z score number of users number of connections number expected freestyle biking 2.11 3.46 48 20 9 skateboarding 1.60 4.15 96 74 46 freestyle frisbee 1.58 4.06 96 74 46 ultimate frisbee 1.46 10.66 312 662 453 ski diving 1.45 5.18 165 174 119 miniature golfing 1.41 14.01 426 1,296 918 computer gaming 1.40 9.78 337 702 501 laser gaming 1.31 4.59 202 264 202 mountain biking 1.30 4.13 210 220 169 bowling 1.28 13.45 585 2,060 1,604 rock climbing 1.28 6.22 302 554 434 road biking 1.27 2.15 124 76 59 couch potatoing 1.26 14.64 674 2,770 2,206 paintballing 1.25 5.55 308 538 431 rollerblading 1.24 3.89 228 280 224 billiards 1.23 10.79 592 1,908 1,549 triathlon 1.23 0.78 54 14 11 snowboarding 1.22 5.34 346 594 486 bungee jumping 1.19 1.54 120 76 64 ice skating 1.19 4.06 305 476 400 weightlifting 1.16 4.49 409 758 655 backpacking 1.16 5.40 477 1,062 918 aerobics 1.12 1.62 196 172 152 jogging 1.10 3.83 532 1,284 1,171 hiking 1.08 4.30 690 2,094 1,939 snow skiing 1.08 2.91 517 1,196 1,112 martial arts 1.05 0.65 211 182 173 bicycling 1.04 0.97 377 564 543
Table C7: Social activities and association ratios.
activity association ratio Z score number of users number of connections number expected raving 1.64 12.00 256 502 305 ballroom dancing 1.61 13.91 329 704 437 latin dancing 1.49 10.80 312 620 416 bar hopping 1.34 17.24 648 2,312 1,720 folk dancing 1.34 1.51 74 26 19 hip-hop dancing 1.33 13.62 526 1,652 1,238 hot tubbing 1.32 17.74 678 2,790 2,121 clubbing 1.24 17.27 828 3,814 3,074 barbecuing 1.20 10.93 680 2,364 1,967 partying 1.18 22.31 1,179 7,372 6,224 camping 1.11 6.83 745 2,618 2,353
Appendix D: Personalities and association ratios
Table D1: How users describe themselves and what kind of people seek out others like them.
personality association ratio Z score number of users number of connections number expected sexy 1.46 5.47 204 192 131 talented 1.40 5.17 213 210 149 fun 1.25 11.22 633 1,852 1,479 weird 1.25 4.32 286 332 265 lovable 1.22 4.20 292 406 333 unique 1.11 4.15 547 1,194 1,074 funny 1.10 4.06 619 1,474 1,345 friendly 1.10 7.55 1,024 4,024 3,674 socially adaptable 1.09 2.12 342 482 440 attractive 1.07 1.76 406 522 486 creative 1.04 1.48 541 982 941 intelligent 1.01 0.42 779 1,848 1,833 responsible 0.99 -0.28 500 686 692 kind 0.99 -0.44 625 1,226 1,239 competent 0.92 -1.40 294 226 246 successful 0.70 -1.57 99 18 25
Table D2: How users spend their free time and whether those who spend their free time in the same way are more likely to be friends.
free time activity association ratio Z score number of users number of connections number expected fulfilling commitments 1.34 9.30 398 826 614 socializing 1.12 21.12 1,660 11,374 10,156 catching up on chores and things 1.09 2.71 494 850 782 learning 1.07 1.82 420 536 498 doing anything exciting 1.07 8.05 1,280 6,278 5,850 watching TV 1.07 1.85 415 602 561 reading 1.02 0.66 631 1,186 1,166 getting outside 1.01 0.97 940 2,882 2,841 staying at home 0.97 -0.32 209 126 129 alone 0.96 -0.93 380 398 415 doing physical challenging activities 0.96 -1.46 577 878 916
Editorial history
Paper received 1 April 2003; accepted 16 May 2003.


Copyright ©2003, First Monday
Copyright ©2003, Lada A. Adamic
Copyright ©2003, Orkut Buyukkokten
Copyright ©2003, Eytan Adar
A social network caught in the Web by Lada A. Adamic, Orkut Buyukkokten, and Eytan Adar
First Monday, volume 8, number 6 (June 2003),
URL: http://firstmonday.org/issues/issue8_6/adamic/index.html