This paper looks at mapping covert networks using data available from news sources on the World Wide Web. Specifically, we examine the network surrounding the tragic events of September 11th 2001. Through public data we are able to map a portion of the network centered on the 19 dead hijackers. This map gives us some insight into the terrorist organization, yet it is incomplete. Suggestions for further work and research are offered.Contents
Introduction and Background
Data Gathering
Prevention or Prosecution?
Conclusion
Introduction and Background
We were all shocked by the tragic events of September 11, 2001. In the non-stop stream of news and analysis one phrase was continuously repeated - "terrorist network." Everyone talked about this concept, and described it as amorphous, invisible, resilient, and dispersed. But no one could produce a visual. Being a consultant and researcher in organizational networks, I set out to map this network of terrorist cells that had so affected all of our lives. My aim was to uncover network patterns that would reveal Al Qaeda's preferred methods of stealth organization. If we know what patterns of organization they prefer, we may know what to look for as we search them out in countries across the world.
I soon realized I would be mapping a 'project team', much like the legal, overt groups I had mapped in hundreds of consulting assignments. Both overt and covert project teams have tasks to complete, information to share, funding to obtain and disburse, schedules to meet, and an objectives to accomplish.
My data sources were publicly released information reported in major newspapers such as the New York Times, Wall Street Journal, Washington Post, and the Los Angeles Times. As I monitored the investigation, it was apparent that the investigators would not be releasing all pertinent network/relationship information and actually may be releasing misinformation to fool the enemy. I soon realized that the data was not going to be as complete and accurate as I had grown accustomed to in mapping and measuring organizational networks.
For guidance I turned to previous work by social network theorists who had studied covert, secret, or illegal networks. I found three excellent papers that formed a working foundation for the knowledge I would use to pursue this project. Malcolm Sparrow (Sparrow, 1991) examines the application of social network analysis to criminal activity. Sparrow describes three problems of criminal network analysis that I soon encountered.
- Incompleteness - the inevitability of missing nodes and links that the investigators will not uncover.
- Fuzzy boundaries - the difficulty in deciding who to include and who not to include.
- Dynamic - these networks are not static, they are always changing.
Instead of looking at the presence or absence of a tie between two individuals, Sparrow suggests looking at the waxing and waning strength of a tie depending upon the time and the task at hand.
Wayne Baker and Robert Faulkner (Baker and Faulkner, 1993) suggest looking at archival data to derive relationship data. The data they used to analyze illegal price-fixing networks were mostly court documents and sworn testimony. This data included accounts of observed interpersonal relationships from various witnesses.
Bonnie Erickson (Erickson, 1981) reveals the importance of trusted prior contacts for the effective functioning of a secret society. The 19 hijackers appeared to have come from a network that had formed while they were completing terrorist training in Afghanistan. Many were school chums from many years ago, some had lived together for years, and others were related by kinship ties. Deep trusted ties, that were not easily visible to outsiders, wove this terror network together.
Data Gathering
Within one week of the attack, information from the investigation started to become public. We soon knew there were 19 hijackers, which planes they were on, and which nation's passports they had used to get into America. As more information about the hijackers' past was uncovered I decided to map links of three strengths (and corresponding thickness). The tie strength would largely be governed by the amount of time together by a pair of terrorists. Those living together or attending the same school or the same classes/training would have the strongest ties. Those traveling together and participating in meetings together would have ties of moderate strength and medium thickness. Finally, those who were recorded as having a single transaction together, or an occasional meeting, and no other ties, I classified as weak ties that were shown with the thinnest links in the network.
I started my mapping project upon seeing several summaries of data about the hijackers in major newspapers (Sydney Morning Herald, 2001; Washington Post, 2001). These data collections contained information about the nodes/hijackers and their links/relationships. From two to six weeks after the event, it appeared that a new relationship or node was added to the network on a daily basis. Several false stories appeared about a cell in Detroit. These stories, originally reported with great fanfare, were proven false within one week. This made me very cautious about adding a link or a node to the network.
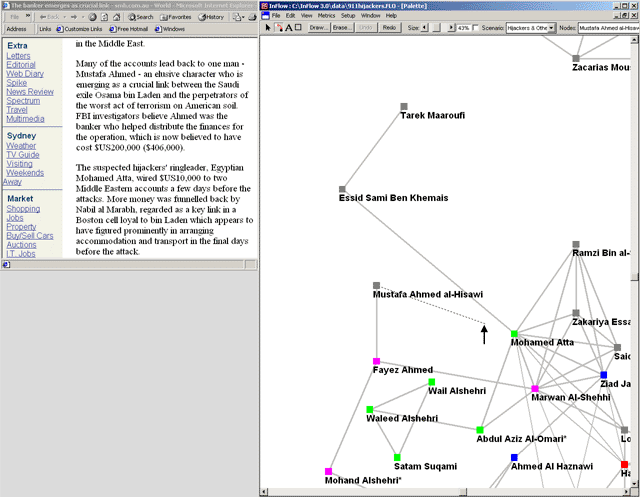
The network was created iteratively as data became available. Everyday I checked the major news sources for updated information. Figure 1 shows my computer screen during this process. The browser window shows the news story, the other window shows the network mapping and measuring software. I would add nodes and links to the map as I read the news accounts. Figure 1 shows a link being added between one of the hijackers and an accomplice.
Figure 1
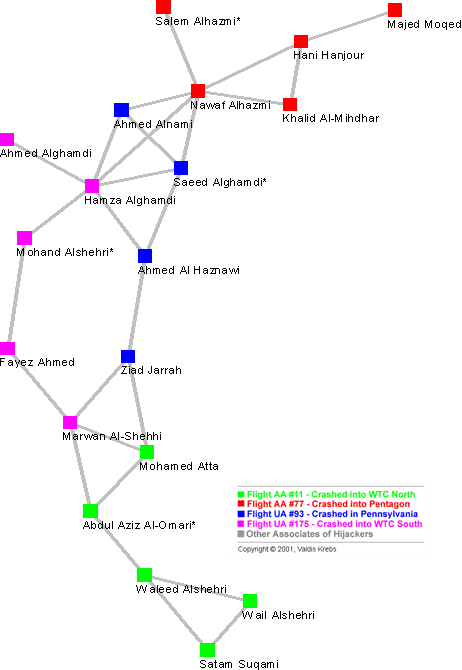
By the middle of October enough data was available to start seeing patterns in the hijacker network. Initially, I examined the prior trusted contacts (Erickson, 1981) - those ties formed long ago through living and learning together. The network self-organized (via a network layout algorithm) into the shape of a serpent - how appropriate, I thought.
Figure 2
I was amazed at how sparse the network was and how distant many of the hijackers on the same team were from each other. Many pairs of team members were beyond the horizon of observability (Friedkin, 1983) from each other - many on the same flight were more than two steps away from each other. A strategy for keeping cell members distant from each other, and from other cells, minimizes damage to the network if a cell member is captured or otherwise compromised. Usama bin Laden even described this plan in his infamous videotape, which was found in Afghanistan. In the transcript (U.S. Department of Defense, 2001) Usama bin Laden mentions:
"Those who were trained to fly didn't know the others. One group of people did not know the other group."The network metrics for the network in Figure 2 are found in Table 1. For a small network of less than 20 nodes, we see a long average path length of 4.75 steps. Several of the hijackers are separated by more than 6 steps. From this metric and bin Laden's comments above we see that covert networks trade efficiency for secrecy.
Table 1: Small-World Network Metrics
Clustering Coefficient Average Path Length Contacts 0.41 4.75 Contacts + Shortcuts 0.42 2.79
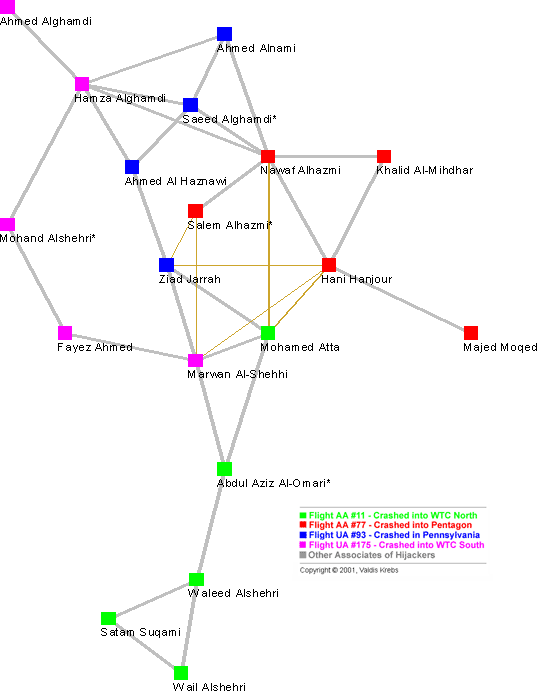
Yet, work has to be done, plans have to be executed. How does a covert network accomplish its goals? Through the judicious use of transitory shortcuts (Watts, 1999) in the network. Meetings were held that connected distant parts of the network to coordinate tasks and report progress. After coordination was accomplished, the cross-ties went dormant. One well documented meeting of the hijacker network took place in Las Vegas. The ties from this and other meetings are shown in gold in Figure 3.
Figure 3
Six (6) shortcuts were added to the network temporarily in order to collaborate and coordinate. These shortcuts reduced the average path length in the network by over 40% thus improving the information flow in the network - see Table 1. When the network is brought closer together by these shortcuts, all of the pilots ended up in a small clique - the perfect structure to efficiently coordinate tasks and activities. There is a constant dynamic between keeping the network hidden and actively using it to accomplish objectives (Baker and Faulkner, 1993).
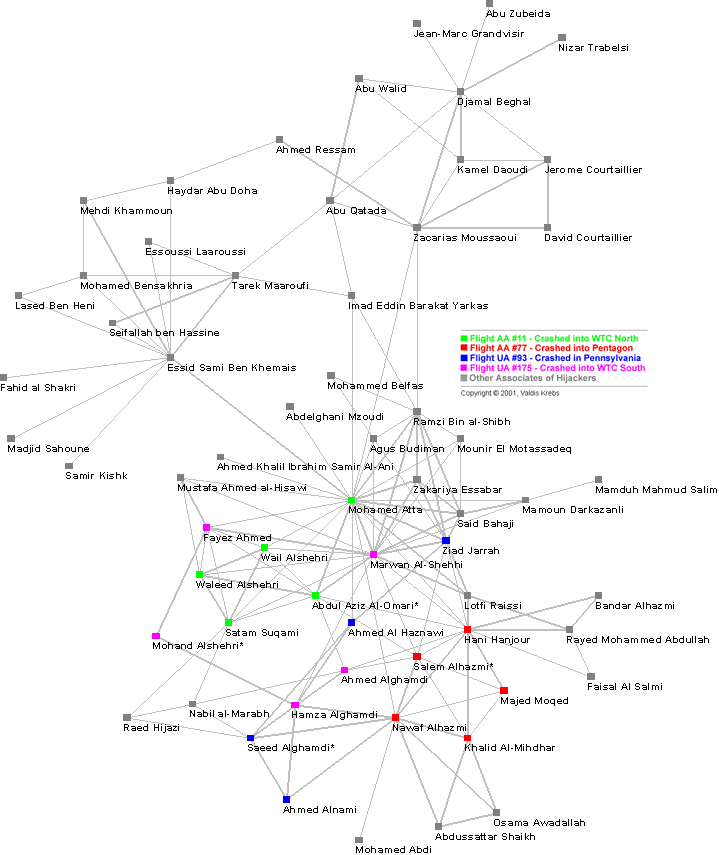
The 19 hijackers did not work alone. They had other accomplices that did not get on the planes. These co-conspirators were conduits for money and also provided needed skills and knowledge. Figure 4 shows the hijackers and their network neighborhood - their direct and indirect associates.
Figure 4
After one month of investigation it was 'common knowledge' that Mohamed Atta was the ring leader of this conspiracy. Again, bin Laden verified Atta's leadership role in the video tape (U.S. Department of Defense, 2001). Looking at the diagram he has the most connections. In Table 2 we see that Atta scores the highest on all network centrality metrics - Degrees, Closeness, and Betweenness (Freeman, 1979). The network metric Degrees reveals Atta's activity in the network. Closeness measures his ability to access others in the network and monitor what is happening. Betweenness shows his control over the flow in the network - he plays the role of a broker in the network. These metrics support his leader status.
Table 2: Hijacker Network Neighborhood
Degrees
* possible false IDBetweenness Closeness 0.361 Mohamed Atta 0.588 Mohamed Atta 0.587 Mohamed Atta 0.295 Marwan Al-Shehhi 0.252 Essid Sami Ben Khemais 0.466 Marwan Al-Shehhi 0.213 Hani Hanjour 0.232 Zacarias Moussaoui 0.445 Hani Hanjour 0.180 Essid Sami Ben Khemais 0.154 Nawaf Alhazmi 0.442 Nawaf Alhazmi 0.180 Nawaf Alhazmi 0.126 Hani Hanjour 0.436 Ramzi Bin al-Shibh 0.164 Ramzi Bin al-Shibh 0.105 Djamal Beghal 0.436 Zacarias Moussaoui 0.164 Ziad Jarrah 0.088 Marwan Al-Shehhi 0.433 Essid Sami Ben Khemais 0.148 Abdul Aziz Al-Omari* 0.050 Satam Suqami 0.424 Abdul Aziz Al-Omari* 0.131 Djamal Beghal 0.048 Ramzi Bin al-Shibh 0.424 Ziad Jarrah 0.131 Fayez Ahmed 0.043 Abu Qatada 0.409 Imad Eddin Barakat Yarkas 0.131 Salem Alhazmi* 0.034 Tarek Maaroufi 0.409 Satam Suqami 0.131 Satam Suqami 0.033 Mamoun Darkazanli 0.407 Fayez Ahmed 0.131 Zacarias Moussaoui 0.029 Imad Eddin Barakat Yarkas 0.404 Lotfi Raissi 0.115 Hamza Alghamdi 0.026 Fayez Ahmed 0.401 Wail Alshehri 0.115 Said Bahaji 0.023 Abdul Aziz Al-Omari* 0.399 Ahmed Al Haznawi 0.098 Khalid Al-Mihdhar 0.022 Hamza Alghamdi 0.399 Said Bahaji 0.098 Saeed Alghamdi* 0.017 Ziad Jarrah 0.391 Agus Budiman 0.098 Tarek Maaroufi 0.015 Ahmed Al Haznawi 0.391 Zakariya Essabar 0.098 Wail Alshehri 0.013 Salem Alhazmi* 0.389 Mamoun Darkazanli 0.098 Wail Alshehri 0.013 Salem Alhazmi* 0.389 Mamoun Darkazanli 0.098 Waleed Alshehri 0.012 Lotfi Raissi 0.389 Mounir El Motassadeq 0.082 Abu Qatada 0.012 Saeed Alghamdi* 0.389 Mustafa Ahmed al-Hisawi 0.082 Agus Budiman 0.011 Agus Budiman 0.372 Abdelghani Mzoudi 0.082 Ahmed Alghamdi 0.007 Ahmed Alghamdi 0.372 Ahmed Khalil Al-Ani 0.082 Lotfi Raissi 0.007 Ahmed Ressam 0.365 Salem Alhazmi* 0.082 Zakariya Essabar 0.007 Haydar Abu Doha 0.361 Hamza Alghamdi 0.066 Ahmed Al Haznawi 0.006 Kamel Daoudi 0.343 Abu Qatada 0.066 Imad Eddin Barakat Yarkas 0.006 Khalid Al-Mihdhar 0.343 Tarek Maaroufi 0.066 Jerome Courtaillier 0.004 Mohamed Bensakhria 0.339 Ahmed Alghamdi 0.066 Kamel Daoudi 0.003 Nabil al-Marabh 0.335 Waleed Alshehri 0.066 Majed Moqed 0.002 Jerome Courtaillier 0.332 Djamal Beghal 0.066 Mamoun Darkazanli 0.002 Mustafa Ahmed al-Hisawi 0.332 Khalid Al-Mihdhar 0.066 Mohamed Bensakhria 0.002 Said Bahaji 0.332 Saeed Alghamdi* 0.066 Mounir El Motassadeq 0.002 Wail Alshehri 0.328 Majed Moqed 0.066 Mustafa Ahmed al-Hisawi 0.001 Abu Walid 0.324 Ahmed Ressam 0.066 Nabil al-Marabh 0.001 Mehdi Khammoun 0.323 Ahmed Alnami 0.066 Rayed Mohammed Abdullah 0.001 Mohand Alshehri* 0.323 Nabil al-Marabh 0.049 Abdussattar Shaikh 0.001 Raed Hijazi 0.321 Haydar Abu Doha 0.049 Abu Walid 0.001 Rayed Mohammed Abdullah 0.319 Mohamed Bensakhria 0.049 Ahmed Alnami 0.001 Waleed Alshehri 0.316 Essoussi Laaroussi 0.049 Haydar Abu Doha 0.000 Abdelghani Mzoudi 0.316 Jerome Courtaillier 0.049 Mehdi Khammoun 0.000 Abdussattar Shaikh 0.316 Kamel Daoudi 0.049 Osama Awadallah 0.000 Abu Zubeida 0.316 Seifallah ben Hassine 0.049 Raed Hijazi 0.000 Ahmed Alnami 0.314 Rayed Mohammed Abdullah 0.033 Ahmed Ressam 0.000 Ahmed Khalil Al-Ani 0.313 Raed Hijazi 0.033 Bandar Alhazmi 0.000 Bandar Alhazmi 0.311 Abdussattar Shaikh 0.033 David Courtaillier 0.000 David Courtaillier 0.311 Bandar Alhazmi 0.033 Essoussi Laaroussi 0.000 Essoussi Laaroussi 0.311 Faisal Al Salmi 0.033 Faisal Al Salmi 0.000 Faisal Al Salmi 0.311 Mohand Alshehri* 0.033 Lased Ben Heni 0.000 Faisal Al Salmi 0.311 Osama Awadallah 0.033 Mohammed Belfas 0.000 Jean-Marc Grandvisir 0.308 Mehdi Khammoun 0.033 Mohand Alshehri* 0.000 Lased Ben Heni 0.308 Mohamed Abdi 0.033 Seifallah ben Hassine 0.000 Madjid Sahoune 0.307 David Courtaillier 0.016 Abdelghani Mzoudi 0.000 Majed Moqed 0.307 Mohammed Belfas 0.016 Abu Zubeida 0.000 Mamduh Mahmud Salim 0.305 Lased Ben Heni 0.016 Ahmed Khalil Al-Ani 0.000 Mohamed Abdi 0.303 Fahid al Shakri 0.016 Fahid al Shakri 0.000 Mohammed Belfas 0.303 Madjid Sahoune 0.016 Jean-Marc Grandvisir 0.000 Mounir El Motassadeq 0.303 Samir Kishk 0.016 Madjid Sahoune 0.000 Nizar Trabelsi 0.281 Mamduh Mahmud Salim 0.016 Mamduh Mahmud Salim 0.000 Osama Awadallah 0.264 Abu Walid 0.016 Mohamed Abdi 0.000 Samir Kishk 0.250 Abu Zubeida 0.016 Nizar Trabelsi 0.000 Seifallah ben Hassine 0.250 Jean-Marc Grandvisir 0.016 Samir Kishk 0.000 Zakariya Essabar 0.250 Nizar Trabelsi 0.081 Average 0.032 Average 0.052 Average 0.289 Centralization 0.565 Centralization 0.482 Centralization
Yet, we are obviously missing nodes and ties in this network. Centrality measures are very sensitive to minor changes in network connectivity. A discovery of a new conspirator or two, or the uncovering of new ties amongst existing nodes can alter who comes out on top in the centrality measures. We must be wary of incomplete data.
Prevention or Prosecution?
Currently, social network analysis (SNA) is applied more successfully to the prosecution, not the prevention, of criminal activities. SNA has a long history of application to evidence mapping in both fraud and criminal conspiracy cases.
As was evident with the September 11th hijackers, once the investigators knew whom to look at, they quickly found the connections amongst the hijackers and also discovered several of the hijackers' associates. We must be careful of 'guilt by association'. Being linked to a terrorist does not prove guilt - but it does invite investigation.
The big question remains - why wasn't this attack predicted and prevented? Everyone expects the intelligence community to uncover these covert plots and stop them before they are executed. Occasionally plots are uncovered and criminal networks are disrupted. But this is very difficult to do. How do you discover a network that focuses on secrecy and stealth?
Covert networks often don't behave like normal social networks (Baker and Faulkner, 1993). Conspirators don't form many ties outside of their immediate cluster and often minimize the activation of existing ties inside the network. Strong ties between prior contacts, which were frequently formed years ago in school and training camps, keep the cells linked. Yet, unlike normal social networks, these strong ties remain mostly dormant and therefore hidden to outsiders.
In a normal social network, strong ties reveal the cluster of network players - it is easy to see who is in the group and who is not. In a covert network, because of their low frequency of activation, strong ties may appear to be weak ties. The less active the network, the more difficult it is to discover. Yet, the covert network has a goal to accomplish. Network members must balance the need for secrecy and stealth with the need for frequent and intense task-based communication (Baker and Faulkner 1993). The covert network must be active at times - it has goals to accomplish. It is during these periods of activity, and increased connectedness, that they may be most vulnerable to discovery.
Ties between members of the hijacker network and outsiders were non-existent. It was often reported that the hijackers kept to themselves - they did not make friends outside the trusted circle. They would rarely interact with others, and then often one of them would speak for the whole group. Eliminating boundary-spanning ties reduces the visibility into the network, and chance of leaks out of the network.
The hijacker's network had a hidden strength - massive redundancy through trusted prior contacts. These ties made the network very resilient. These ties were solidly in place as the hijackers made their way to America. These strong ties were rarely active - they were mostly invisible during their stay in America. It was only after the tragic event that intelligence from Germany and other countries, revealed the apparent center of this violent network. The dense connections of the 'Hamburg cell' are now obvious in Figure 4.
This dense under-layer of prior trusted relationships made the hijacker network both stealth and resilient. Although we do not know all of the internal ties of the hijackers' network it appears that many of the ties were concentrated around the pilots. This is a risky move for a covert network. Concentrating both unique skills and connectivity in the same nodes makes the network easier to disrupt - once it is discovered. Peter Klerks (Klerks, 2001) makes an excellent argument for targeting those nodes in the network that have unique skills. By removing those necessary skills from the project, we can inflict maximum damage to the project mission and goals. It is possible that those with unique skills would also have unique ties within the network. Because of their unique human capital and their high social capital the pilots were the richest targets for removal from the network. Unfortunately they were not discovered in time.
Conclusion
To draw an accurate picture of a covert network, we need to identify task and trust ties between the conspirators. The same four relationships we often map in many business organizations would tell us much about illegal organizations. This data is occasionally difficult to unearth with cooperating clients. With covert criminals, the task is enormous, and may be impossible to complete. Table 3 below lists multiple project networks and possible data sources about covert collaborators.
Table 3: Networks to Map
Relationship/Network Data Sources 1. Trust Prior contacts in family, neighborhood, school, military, club or organization. Public and court records. Data may only be available in suspect's native country. 2. Task Logs and records of phone calls, electronic mail, chat rooms, instant messages, Web site visits. Travel records. Human intelligence: observation of meetings and attendance at common events. 3. Money & Resources Bank account and money transfer records. Pattern and location of credit card use. Prior court records. Human intelligence: observation of visits to alternate banking resources such as Hawala. 4. Strategy & Goals Web sites. Videos and encrypted disks delivered by courier. Travel records. Human intelligence: observation of meetings and attendance at common events.
Of course, the common network researcher will not have access to many of these sources. The researcher's best sources may be public court proceedings, which contain much of this data (Baker and Faulkner, 1993; U.S. Department of Justice, 2001).
The best solution for network disruption may be to discover possible suspects and then, via snowball sampling, map their individual personal networks - see whom else they lead to, and where they overlap. To find these suspects it appears that the best method is for diverse intelligence agencies to aggregate their individual information into a larger emergent map. By sharing information and knowledge, a more complete picture of possible danger can be drawn. In my data search I came across many news accounts where one agency, or country, had data that another would have found very useful. To win this fight against terrorism it appears that the good guys have to build a better information and knowledge sharing network than the bad guys (Ronfeldt and Arquilla, 2001).
About the Author
Valdis Krebs leads his own firm, orgnet.com, which provides social network analysis software and services to the consulting community. He has been mapping and measuring human networks within and between organizations since 1988. He is also involved in the following research: networks in adaptive organizations, industry clusters/ecosystems, and network vulnerability.
E-mail: valdis@orgnet.com
Acknowledgments
An earlier version of this paper was originally published in volume 24, number 3 (2001) of Connections, the official journal of the International Network for Social Network Analysis and appears here with the kind permission of Connections and the International Network for Social Network Analysis. Copyright © 2001, INSNA and Valdis E. Krebs.
References
Wayne E. Baker and Robert R. Faulkner, 1993. "The Social Organization of Conspiracy: Illegal Networks in the Heavy Electrical Equipment Industry," American Sociological Review, volume 58, number 6 (December), pp. 837-860.
Bonnie H. Erickson, 1981. "Secret Societies and Social Structure," Social Forces, volume 60, number 1 (September), pp. 188-210.
Linton C. Freeman, 1979. "Centrality in Social Networks: Conceptual Clarification," Social Networks, volume 1, pp. 215-239.
Noah E. Friedkin, 1983. "Horizons of Observability and Limits of Informal Control in Organizations," Social Forces, volume 62, pp. 54-77.
Peter Klerks, 2001. "The network paradigm applied to criminal organizations," Connections, volume 24, number 3, pp. 53-65.
Valdis E. Krebs, 2001. "Network Metrics." InFlow 3.0 Users' Manual.
Valdis E. Krebs, 1996. "Visualizing Human Networks," Release 1.0 (February), pp. 1-25.
David Ronfeldt and John Arquilla. 2001. "Networks, Netwars, and the Fight for the Future," First Monday, volume 6, number 10 (October), at http://firstmonday.org/issues/issue6_10/ronfeldt/, accessed 25 March 2002.
Tom Stewart, 2001. "Six Degrees of Mohamed Atta," Business 2.0 (December), p. 63, and at http://www.business2.com/articles/mag/0,1640,35253,FF.html, accessed 25 March 2002.
Malcolm K. Sparrow, 1991. "The application of network analysis to criminal intelligence: An assessment of the prospects," Social Networks, volume 13, pp. 251-274.
Sydney Morning Herald, 2001. "The hijackers ... and how they were connected," (22 September), at http://www.smh.com.au/.
U.S. Department of Defense. 2001. "Transcript of bin Laden Video Tape," (13 December), at http://www.defenselink.mil/news/Dec2001/d20011213ubl.pdf, accessed 25 March 2002.U.S. Department of Justice, 2001. "Indictment of Zacarias Moussaoui," (11 December), at http://www.usdoj.gov/ag/moussaouiindictment.htm, accessed 25 March 2002.
Washington Post, 2001. "The Plot: A Web of Connections," (24 September), at http://www.washingtonpost.com/wp-srv/nation/graphics/attack/investigation_24.html, accessed 25 March 2002.
Duncan J. Watts, 1999. "Networks, Dynamics, and the Small-World Phenomenon," American Journal of Sociology, volume 13, number 2, pp. 493-527.
Editorial history
Paper received 20 March 2002; accepted 25 March 2002.


Copyright ©2002, First Monday
Uncloaking Terrorist Networks by Valdis E. Krebs
First Monday, volume 7, number 4 (April 2002),
URL: http://firstmonday.org/issues/issue7_4/krebs/index.html