
Remote Internet voting has been proposed as a solution to low voter turnout. It is tempting to see the use of Internet technology by a large segment of the population as a quick fix for making the voting process more accessible to a larger number of people. This argument, however, demonstrates a disconnect with the reality of Internet use; that is, that it happens in a place. Internet use is not an ethereal, boundary–less activity, it is situated in a spatial/geographic context. Reviewing this geographic context using Geographic Information System technology can reveal the serious limitations of a "point and click" solution to improving political participation.
In the mid–nineties as information and communications technology (ICT) became increasingly pervasive, there was a great deal of concern over what came to be called "the digital divide." This term described the appearance of a widening gap between those who were participating in this digital explosion and enjoying the many benefits it seemed to afford and those who, for economic, social, or cultural reasons, were not. The digital divide quickly became a prominent policy issue for the Clinton Administration and a great deal of money and political energy was directed at closing the gap. Recently, however, the digital divide seems to have lost much of its currency as a policy issue. For instance, links to the U.S. Commerce Department’s site on the digital divide ( http://www.digitaldivide.gov) now, without explanation, delivers a " page not found" message. The last report of the National Telecommunications and Information Administration (a division within the Commerce Department) addressing the digital divide appeared in 1999. Finally, President Bush’s 2003 budget proposal included the elimination of programs run out of the U.S. Education and Commerce Departments that were designed to ameliorate the division between technological haves and have–nots.
While the public rhetoric and attention given to the digital divide has diminished in recent years, the importance of computers and the Internet in our social, economic, and political lives has only increased. More and more goods and services are not only available online, but are only available online or available online at reduced costs. Additionally we see the Internet being used as a way to communicate with voters by an ever increasing percentage of local and national political campaigns. An enormous amount of information about the candidates, their positions, and their records is available online. Perhaps most importantly, arguments to make the voting process a completely "online" experience continue to circulate, with a number of states experimenting with an online voting environment and many EU countries leading the way.
Problems with security, authentication, and privacy are generally cited as the more significant barriers to an online voting system, but even if those more technical problems were addressed, this paper argues that merging voting and ICT gives new relevance to the concerns raised originally by the emergence of the digital divide. Both voter turnout and Internet usage rates have well documented demographic components, income groups, racial groups, age groups, and education groups have different usage rates.
This paper examines what it would mean to see both political participation and Internet usage as in part, geographic phenomena and use to Geographic Information Systems to explore the ways in which they intersect geographically. Are there areas of the county and of states that already suffer from low political participation and how might those areas possibly be increasingly marginalized (or perhaps increasingly brought into the political process) by moving voting online? Are there people living at the intersection between low voter turnout and low Internet access, and what might be done to protect these areas? Voting is the most important and universal interactive political act in this country. Looking at the two phenomena spatially rather than just demographically can provoke and inform discussions of the social and political consequences of moving voting online.
It is worthwhile at this point to distinguish between "e–voting" and "i–voting." The term e–voting, or electronic voting, is generally used to describe any use of digital computing in the voting process, or more accurately in the casting of votes. I–voting, or Internet voting, refers more specifically to the casting of votes over the Internet, whether from a home computer, from work, or from a public space like the library. Undoubtedly computers will continue to play an increasingly significant role in the voting process from tabulating and transporting results to actually recording votes. While the digitization of voting processes and procedures raises many important questions about how computers and computing might dramatically alter the character of these processes, this paper will concern itself solely with i–voting as it has the most dramatic spatial component.
Somewhat paradoxically, the issue of enfranchisement lies at the heart of both the argument for Internet voting and the argument against Internet voting. Arguments for allowing for votes to be cast on the Internet generally claim that doing so will increase voter turnout, especially among young people. Rachael Gibson (2001) summarizes the arguments for i–voting in this way:
" ...participation rates among the disabled, the elderly, single mothers, remote rural dwellers, expatriates, and busy professionals would increase if RIV [remote Internet voting] were adopted. Beyond these particular groups, however, the reduction of time and effort expended in getting to the polls would significantly cut the costs of voting for most citizens and thus lead to a general increase in participation. In addition, given the enthusiasm of younger people for the Internet, I–voting is seen as a way to offset their traditionally low rates of turnout." [ 1]Internet voting proponents believe that moving voting online would make the process more inclusive and increase turnout rates amongst those who because of material constraints or personal preference would find the virtual act of voting easier than the physical.
By way of analogy, it would be like giving affluent, well–educated voters the day off from work and a chauffeured ride to their polling places while expecting all other voters to make their way as best they could.
Those expressing caution over i–voting on the other hand are concerned about, among other things, the implications of enhanced access to the electoral process without equal access. From Gibson (2001) again:
By allowing people to vote from their PCs at home or work at any time of the day or night over an extended period of time, the costs of voting are lowered and the likelihood of participation is enhanced, but only for those with Internet access. Thus, while there is no systematic denial of the right to exercise the franchise, the barriers to voting are lowered for a particular subset of voters, creating a fundamentally unequal situation." [ 2]In other words, i–voting risks disfranchising large segments of the population, not by creating barriers to their participation but by reducing the participation barriers of more technologically advanced voters to a much greater extent than other segments of the population. By way of analogy, it would be like giving affluent, well–educated voters the day off from work and a chauffeured ride to their polling places while expecting all other voters to make their way as best they could.
For the purposes of this study, Internet use information was gathered from the U.S. Census Bureau’s Current Population Survey of 2000 which included numerous questions about if, where, and why people were using the Internet. Voting statistics were gathered from the U.S. Census Bureau’s Current Population Survey of November 2002. Although this data is slightly dated, the numbers are meant to be comparative, not definitive. For both surveys I dealt only with responses from people who were eligible to vote; that is to say, eighteen and older. As a gauge of political participation, I use the answer to the question as to whether or not the respondent voted in the November election. Internet usage is characterized in this paper as the answer to the question as to whether or not they use the Internet at home. While it is certainly possible that respondents could not use the Internet at home and still have access at work, their local library, or some other public space, I take home usage as the most important indicator for a number of reasons. One is that home use is of a different character then use outside the home; it is both more regular and more private, both qualities that online voting wishes to capitalize on. Also, there is evidence that home use would be the preferred method of people voting online, despite more public stations being available. In Rachael Gibson’s analysis of the Arizona primary of 2000, the only official i–voting that has occurred in this country, she reports that only 10 percent of the Internet votes cast were cast at the 124 public polling stations around the state [ 3]. Additionally, a recent Pew Internet and American Life Project study (Lenhart,
2003) found that of the 42 percent of Americans who describe themselves as Internet non–users, 60 percent report that they "know of a place in their community where Internet access is publicly available, while 76 percent of Internet users know of public access sites. Most of those who know of local access points say those access points are easy to reach" [ 4]So it not clear that people with no Internet access at home find public access points to be an acceptable substitute despite knowing about them and being able to access them easily. Additionally, while work may be a place that many people use the Internet, if our political process is going to depend to some extent on voters’ access to the Internet, it would be inappropriate to count work access as an acceptable part of the voting process. A basic tenant of our electoral process is that it is free from coercion. Expecting or relying on people to vote at work would make it difficult — if not impossible — to ensure that voting is occurring in a non–coercive environment as the workplace is coercive by nature.
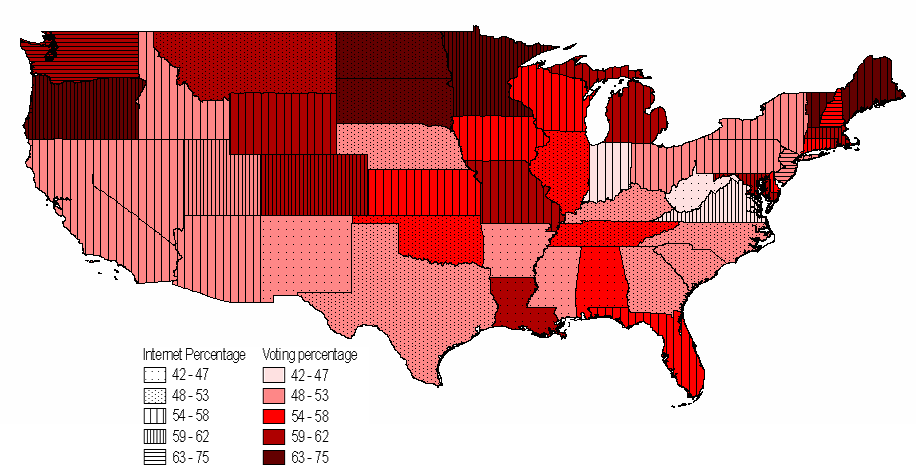
In order to look at the phenomena of voting and interent use geographically, data from the two Current Population Surveys were complied in SPSS. Internet usuage and voting both were cross–tabulated against the forty–eight lower states. The resulting tables were brought into GIS ArcView and the map below (Figure 1) was produced. State voting percentages are representated by the varying shades of red, with the lower percentages being represented by the lighter colors. Internet usuage is represented by lines and dots, dots for the lower percentages and lines for the higher percentages. It is easy to see some regional themes emerge. There are low Internet usuage rates and median or low voting rates in the South. The Midwest and West are slightly higher then the South on both indicators and then the Northwest and Northeast have comparitively high rates of both voting and Internet usage.
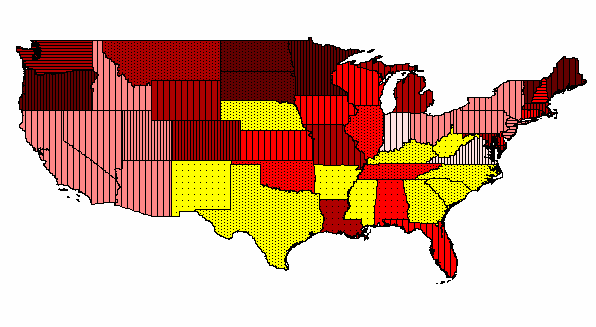
Figure 1: Voting and the Internet, based on data from recent Current Population Surveys.Using GIS/ArcView also makes it very easy to identify states that fall below the median in both Internet connectivity at home and in political participation. As Figure 2 indicates, these states are: Arkansas, Nebraska, West Virginia, Kentucky, New Mexico, North Carolina, Texas, Mississippi, Georgia, and South Carolina. These states could be described as being in the i–voting "danger zone:" with voter participation and Internet connectivity already low, it is unlikely that they would benefit from merging voting and ICT. It is not surprising, but it is nevertheless instructive that many of these states in this "danger zone" have large populations who are already linguistically, economically, and educationally disadvantaged.
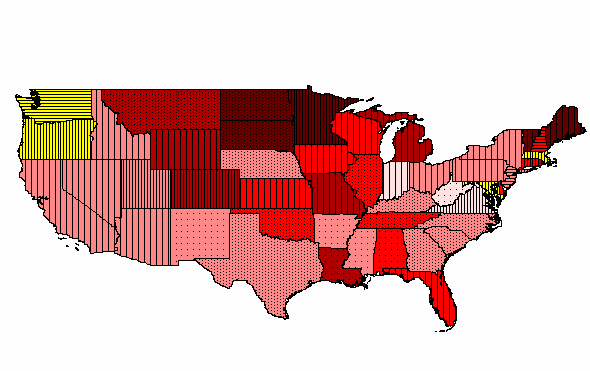
Figure 2: Voting and the Internet: states below the median in Internet connectivity at home and political participation.Alternatively, Figure 3 indicates that Oregon, Washington, Maryland, and Massachusetts have higher–than–median percentages in both Internet connectivity and voter participation. The effect of shifting electoral participation online may be relatively minimal in these four states, as the majority of their citizenry are already digitally and politically engaged at a level well above the national average.
Figure 3: Voting and the Internet: states above the median in Internet connectivity at home and political participation.This analysis is at the state level. As there is strong positive correlation between income and both voting and Internet access, we can use income information from the 2000 U.S. Census to take a look at how these trends might play out on the block group level. Table 1 outlines the percentages of people in each income group that report using the Internet at home and report having voted in the November election.
Income level (U.S.$) Access to the Internet at home Voted in the U.S. national election (totals < 100 percent attributable to no responses, refused to respond, and don’t know) Response Yes (percentage) No (percentage) Yes (percentage) No (percentage) < $9,999 19.2 80.8 28.2 56.8 $10,000 to $19,999 23.4 76.6 35.6 48.8 $20,000 to $34,999 40.2 59.8 40.5 44.2 $35,000 to $59,999 62.4 37.6 47.8 40.1 > $60,000 82.8 17.2 56.8 33.1 Table 1: Income, Internet use at home, and the U.S. November election.
When these percentages are cross–tabulated against the income groups listed above, the result is five income groups representing the lowest Internet usage and voting rates through highest Internet usage and voting raters. Internet usage appears to be a much more variable phenomenon than voting. This variability should raise reds flags when thinking about moving voting online since the goal for political participation is less variability (i.e., universal participation) not more.
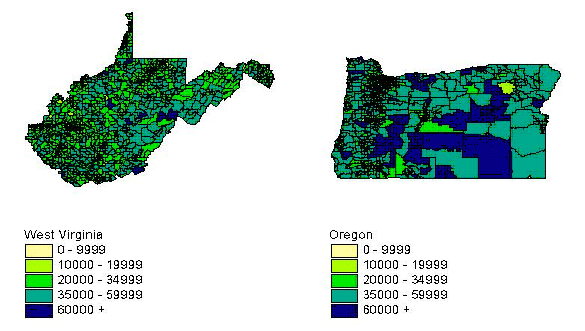
By moving this data into GIS/ArcView, we can see how well our expectations of voting and Internet usage are met when looked at in a geographic context. West Virginia and Oregon are two good states to look at in that respect. West Virginia has the lowest combination of Internet use and voting 42 percent and 46 percent respectively. Oregon represents the opposite end of the spectrum having an Internet use percentage of 63 and a voting percentage of 62. The maps below (figure 4) are the average incomes for each block group.
Figure 4: West Virginia and Oregon, average income of block groups.A quick glance suggests that income goes a far way in explaining the relative rankings of the two states in terms of voter participation and Internet use: Oregon, for instance, clearly has more block groups with average incomes of $35,000 and above. Oregon also appears to have more block groups in the important $60,000+ income range where over 80 percent of people report Internet usage at home (a check in the ArcView software confirms that to be true — West Virginia has approximately one percent of its block groups at this average income level, Oregon has approximately six percent). If voting were shifted towards an online format, West Virginia would need a different implementation strategy than Oregon.
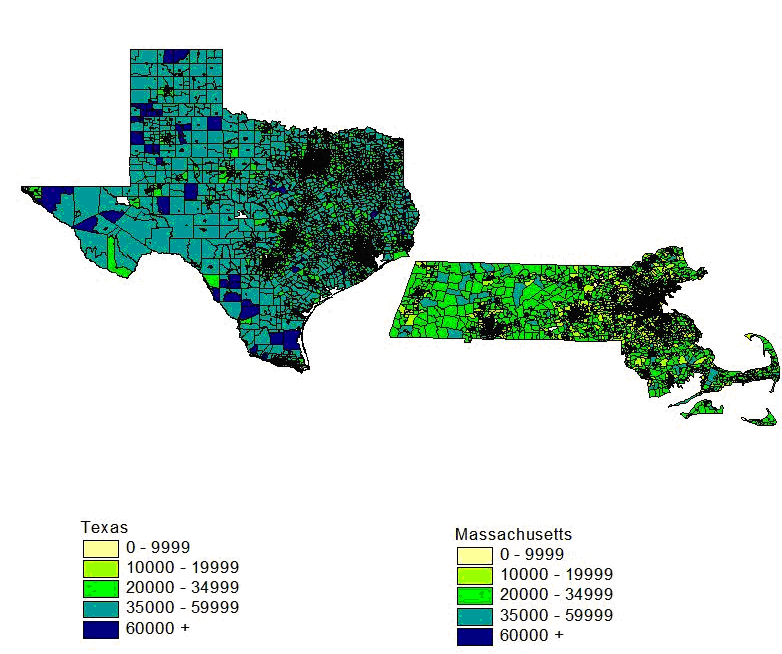
It is also clear using the GIS/ArcView, however, that income doesn’t tell the whole story when looking at two other states that fall below and above the median: Texas and Massachusetts respectively.
Figure 5: Texas and Massachusetts, average income of block groups.Texas falls below the median in both Internet usage and voter participation while Massachusetts falls above the median in both categories. Looking at the maps that display the average incomes of their block groups would suggest that the opposite were true. The average income of most of the block groups in Massachusetts are at the median or below, yet these income groups we have characterized as both low voters and low Internet users. Massachusetts, however, is located in the Northeast, where there is an abundance of telecommunications activity. Its geographic location may be, in this instance, a more important factor than its income levels in explaining its high rate of Internet usage. Similarly local political traditions are important in Massachusetts and may be a more powerful indicator than income levels in explaining voter participation. In other words, location and local conditions are equally as important to consider if voting were to be moved online as demographic factors.
State Internet Use (percentage) Voting (percentage) Louisiana 44 60 Montana 53 61 New Jersey 64 51 North Dakota 53 64 South Dakota 53 73 Utah 60 51 Table 2: States with differential rates of Internet use and voting.
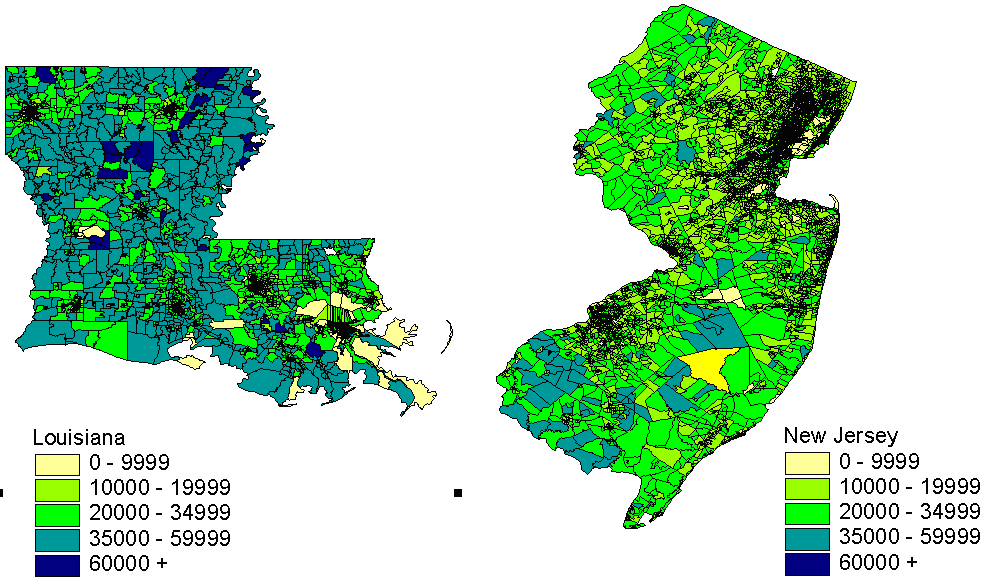
Other income maps for other states also suggest that income levels can’t tell the whole story. Using GIS we can also easily identify the outlying states, the ones that fall above the median in one category and below the median in another. Table 2 lists the six states that fall into this category. If we look more closely in Figure 6 at Louisiana and New Jersey we see a similar unexpected pattern. New Jersey, despite an income map with very few high–income block groups, has a high Internet use percentage. New Jersey, like Massachusetts is surrounded by states that record high Internet usage. Louisiana, with income demographics that suggest at least average Internet use, is surrounded by states with low Internet use.
Figure 6: Louisiana and New Jersey, average income of block groups.Certainly the majority of states have an Internet usage and a voting percentage that are very close together; the average standard deviation is 4.17 percentage points. Nevertheless, the examples above demonstrate that there are important variations that are not solely explicable using standard demographic explanations.
What conclusions can we draw from the numbers and the maps presented above? One benefit to this kind of presentation is that, for most of the United States at least, what we see geographically is what has been noticed demographically. That is, the "universe of voters and the universe of people online have largely merged" [ 5]. This geographic and demographic convergence suggest that Internet voting would largely benefit those who already vote, thus presenting the risk of further alienating citizens already removed from the political process.
Tony Grubesic (2002) draws a similar conclusion in his study of Internet activity (which he measures using domain name registration) in Ohio. His findings suggest that Internet activity is heavily concentrated in the major metropolitan areas. He maintains that "it is increasingly apparent that the diffusion of information technologies and their associated activity is spatially uneven." [ 6]. Contrary to the commonplace notion that economic activity conducted in the virtual space of the Internet makes actual geographic space irrelevant, Grubesic contends that online economic activity in fact looks remarkably like traditional economic activity that is physically bounded. This mirroring effect suggests to Grubesic that "although the Internet is able to facilitate communication across significant distances, it has not necessarily created the rapid decentralizations of economic and social activities that was once predicted" [7].
The apparent spatial or geographic concentration of voting and Internet usage becomes particularly compelling when put against results from the Pew study run from March–May 2002, which concluded
"that 24 percent of Americans live lives far removed from the online world. They have never tried it and often do not know many people who have ever tried it. They do not live in connected households" [ 8].Proposing a remote Internet solution to increase voter turnout ignores the fundamental fact that it is people who vote and people live in places.
Almost one quarter of Americans have almost no familiarity with the mechanism that is being proposed as a solution to the problem of low voter turnout. To this somewhat startling figure, we can add that over three quarters of Americans reside in block groups in which the majority of people who live there (approx. 60 percent) do not use the Internet at home and a similar majority (again approx. 60 percent) do not vote. While there is no evidence of a correlation between not voting and not using the Internet, statistically we are able to postulate that in these block groups (where, again, 78 percent of the population lives) anywhere from 20 percent to 60 percent neither vote nor use the Internet. Even if we are conservative in our estimate, we can say that in most areas of the country at least 20 percent of the population are both not voting and not using the Internet. These people reside outside of two major public communicative arenas of our time: the Internet and the voting process. To what extent does their absence compromise our political community, our shared cultural and social life?
Sharon Strover (2003) argues that "the focus on technologies as discrete systems and their users as isolated individuals masks some of the contradictory ideas that routinely accompany information technology policy and programs" [ 9]. One contradictory idea that we have discovered is that while the rhetoric of the Internet is one of both decentralization and connectedness, the behavior of Internet activity is similar to other social phenomena. It tends to cluster around centers of cultural and economic power and instead of creating new connections, it reinforces other indicators of connectedness, including potentially voting. Proposing a remote Internet solution to increase voter turnout ignores the fundamental fact that it is people who vote and people live in places. In an online voting scenario it appears highly likely that the majority of what would be millions of new "polling stations" would be located in the homes of the affluent and in homes where the people in them already vote. In consequence, instead of involving more people in the electoral process, i–voting brings with it the risk of compounding the disconnectedness of large segments of the population. Relocating a large percentage of the voting activity from traditional polling stations into the virtual world demands a greater analysis, not a lesser, of the idea and role of place in voting patterns.
About the author
Stephanie Birdsall is the Communications Specialist for the Computing and Information Services at Brown University.
Acknowledgements
I would like to thank Dr. Jack Combs, Research Administrator at the Center for Public Policy & American Institutions at Brown University, for his patient assistance in accessing and preparing the data for this paper. I would also like to thank James Cahill for reading and commenting on early drafts of this paper.
Notes
4. Lenhart, et al., 2003, p. 3.
8. Lenhart, et al., 2003, p. 25.
References
Rachael Gibson, 2001. "Elections online: Assessing Internet voting in light of the Arizona Democratic primary," Political Science Quarterly, volume 126, number 4, pp. 561–583.
Tony H. Grubesic, 2002. "Spatial dimensions of Internet activity," Telecommunications Policy, volume 26, pp. 363–387.
Amanda Lenhart, and others, 2003. The Ever–shifting Internet population: A new look at Internet access and the digital divide. Pew Internet and American Life Project, at http://www.pewinternet.org/pdfs/PIP_Shifting_Net_Pop_Report.pdf, accessed 2 December 2004.
Roger Alan Stone, 2004. "The Internet as a get out the vote tool," Campaigns & Elections, volume 25, number 8, p. 2.
Sharon Strover, 2003. "Remapping the digital divide," Information Society, volume 19, pp. 275–277.
Editorial history
Paper received 17 February 2005; accepted 18 March 2005.


This work is licensed under a Creative Commons License.The democratic divide by Stephanie Birdsall
First Monday, volume 10, number 4 (April 2005),
URL: http://firstmonday.org/issues/issue10_4/birdsall/index.html