The increased commercialisation of Internet domain sales created the unanticipated side effect that domain extensions no longer signify the residence of the domain user. As a result, the analysis of the domain attributes in the Web access logs no longer provides accurate information on the origin of the users and thus of the geographical ‘reach’ of a given site. This study provides an alternative method to assess the geographical ‘reach’ by calculating the average demand for Web pages in hourly intervals originating from each time zone. The resulting analysis tool, which relates to Greenwich Mean Time, is location independent and can be applied to Web sites world wide.Contents
Introduction
Hourly demand as a solution?
Daily human life patterns and Web usage
Distribution of Web users in the world
Introduction
One of the major selling points of an on-line presence is that ‘business is conducted 24/7’, that is at all times of the day of any given day of the year. From a business perspective, it is worth considering though, whether this actually occurs, or whether it is a mere figment of managerial imagination.
Geographical analysis of the users is becoming increasingly problematic, because (i) many servers calling up a Web site provide unresolved URLs; and, (ii) the .com, .net and .org domains are also used outside the U.S. Unresolved URLs are calls made to a Web server where the DNS entry of the calling server does not extend beyond its numerical IP address. Locational information, through a coded domain name (such as .au, .de, .fr, etc.) is not provided. As result of the sale of domain names it is now possible to register domains in various countries without maintaining a server there. Furthermore, the increasing globalisation of the communications industry has seen an expansion of U.S. communication companies. Many of these now offer services in Germany, Canada, Australia and other countries. While these providers have resolved their DNS entries, they end in ‘.net’ (such as bellsouth.net, comcast.net, etc.) or ‘.com’ (such as rr.com, charter.com). While it is often possible to analyse the server logs and ‘break’ the location code of some of these providers, this is cumbersome. It is near impossible to do so for the unresolved IP addresses, even with a reasonable level of effort for each.
Standard, publicly available Web site statistics provide information on a wide range of data, both on absolute usage and on a temporal scale well as permit the tracking of users’ movements through a Web site (Petersen 2004; 2005). Many of the commercial programs are either too technical for the lay person, or the Web site maintained is not deemed to warrant expenditure in commercial applications or analysis contracts. There is a need for a rough–and–ready method that allows anyone with access to basic Web site statistics to estimate the internationality of a site.
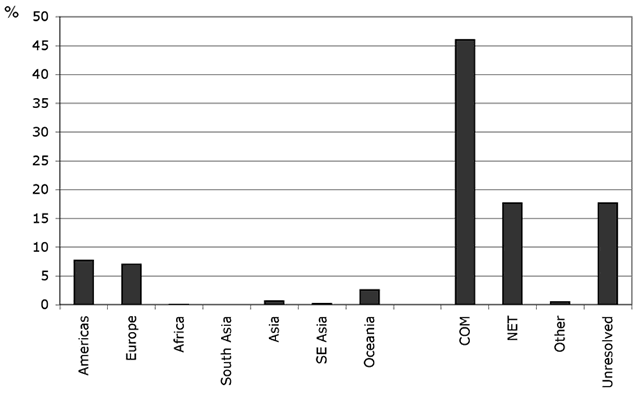
The author, a university academic, maintains ‘The Marshall Islands — A Digital Library and Archive,’ a Web site providing a wide range of primary and secondary source material on that Pacific Island country ( http://marshall.csu.edu.au). The subject matter, covering all aspects of history, culture, health, politics and economy of the island country, appeals to the Internet user population as a whole, but to ensure that the site meets the expectations of the audience, it is necessary to understand the origin and nature of the users, as well as what information they are seeking. An analysis of the user population and their needs has been carried out (Spennemann, 2004). One of the key questions to be answered asks how international the site usage actually is. Figure 1 sets out the frequency of domains requesting pages from the Marshall Islands site arranged by continent for the quarter November 2003 to January 2004. The heavy preponderance of .com. .net and unresolved domains is self–evident, distorting any meaningful analysis. Attributing all .com and .net domains to users in the U.S. is clearly untenable in the light of the international sales of Web domains.
Figure 1: Frequency of domains requesting pages from the Marshall Islands site arranged by continent.
Alternative options, such as assessing the frequency of links pointing to the site, or the Google rank (rank 3, search term ‘Marshall Islands’) only provide an estimate of the popularity of the site among other Web service providers, but do not provide information on the origin of the actual users. The same applies to the unsolicited comments and information queries that the site generates.
In view of this an alternative method had to be found that provides some measure to assess the ‘internationality’ of the Web site. This paper will provide a comparatively simple method that allows Web site authors to gain an indication on the range of utilisation, based on the hourly frequency of server calls. The method described below is also designed in such a way that it allows to assess any changes in internationality over time.
Hourly demand as a solution?
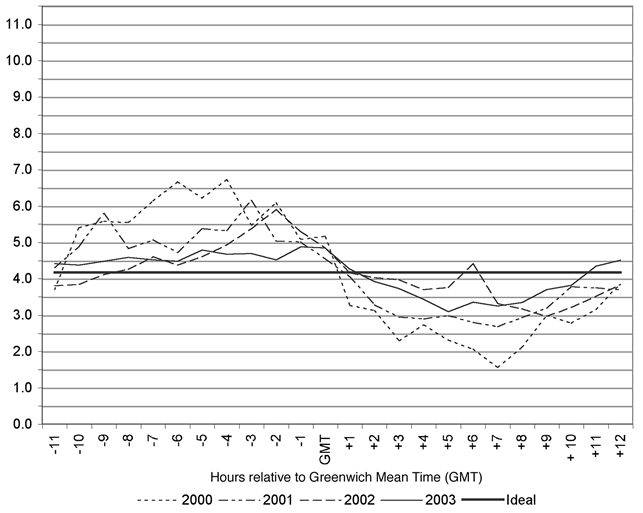
Figure 2 shows the average hourly demand for pages of the Marshall Islands site (in percentage of requests per day) for the period 2000 to May 2004. The data for 2000 and 2001 (until August inclusive) are based on portal page access only; for September 2001 to March 2002 they are based on all pages, with statistics provided courtesy of Netscape’s now defunct ‘hitometer service.’ Commencing April 2002 accurate server–level statistics (through logs) became available. To smooth monthly variations in load, the totals were expressed in percent. These monthly percentage values were then averaged for each year.
The hourly demand curve shows a gradual flattening out — nearing the theoretical ideal loading for a server. Does this mean that the demand for the service provided by the Marshall Islands site is nearing the ideal world–wide audience? Before we can answer this question, however, we briefly need to look at the patterns of human daily life.
Figure 2: Average hourly demand for pages of the Marshall Islands site (in percentage of requests per day) for 2000 to 2003, compared to the ideal load (time zone is Greenwich Mean Time)..
Daily human life patterns and Web usage
The normal day–to–day life pattern of a citizen of a Western, industrialised country follows the routines of works, leisure and sleep. Daily routines, such as working, using the public roads network, as well as using communications media such as the telephone, follow a diurnal pattern, whereby usage is at its lowest during the early hours of the morning, and at its highest in the middle of the day. Other activities, such as leisure (e.g., watching television) follow similar curves, taking into account time spent at work.
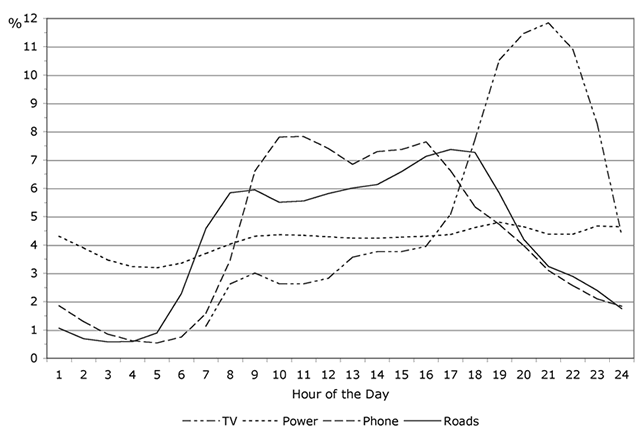
Figure 3: Diurnal variation in the demand for electricity, road traffic, telephone services and television (whole week).
Figure 3 shows the diurnal variation in the demands for electricity (Albury, Australia); roads (Seattle, Wash.; 2x Sydney, NSW; State of Vermont); telephone (six switches along the West Coast of the U.S.; seven exchanges along the eastern seaboard of Australia) and television (Australia). These data clearly demonstrate the different demands on services by work conditions: telephone usage is concentrated in the standard work hours 8:00 to 17:00, while high road usage starts and ends about one hour outside the standard work hours. Television usage, on the other hand is a widely used leisure activity, which, not surprisingly, peaks after the conclusion of the work day. The exception is the curve that for electricity. While it shows a small depression in the hours of early morning, the majority of the curve is flat. This is hardly surprising given that electricity supply is a regulated product, which is generated solely based on demand. Here the providers have the opportunity to level out the curve close to the theoretical ideal.
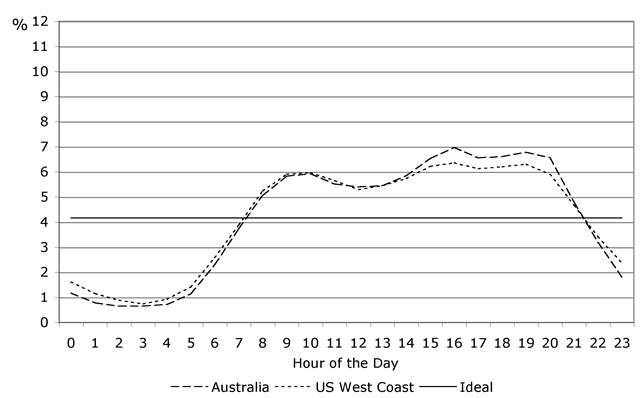
Web usage on the other hand, is a combination of work and leisure activity. Thus we can expect a combination of demand during and after work hours, with a low demand in the early hours of the morning. A Web usage standard was calculated based on the average number of dial up call made through ten exchanges, five on the western seaboard of the United States and five on the eastern seaboard of Australia. PacWest provided the data for the five U.S. exchanges (Phoenix, Ariz.; Seattle, Wash.; Stockton, Calif.; Los Angeles, Calif. [2 x]), while Telstra and Albury Internet provided the five Australian data sets (Albury, Brisbane, Melbourne, Sydney [2x]). Figure 4 shows just how similar the Australian and U.S. averages are, with the Australian Web users showing a slightly higher usage in the hours between 4 pm and 9 pm.
Web usage is high at the start of the work day and then peaks at the end of the work period, with another slight peak by 7 pm, presumably after the dinner period, representing those who come online in the evening (Figure 4). Table 1 provides the raw data set to permit the reader a comparison with their own Web site demand curves.
Table 1: Web usage — Standard for a single time zone.
Local time Percentage 00:00–01:00 1.45 01:00–02:00 1.01 02:00–03:00 0.80 03:00–04:00 0.72 04:00–05:00 0.83 05:00–06:00 1.27 06:00–07:00 2.34 07:00–08:00 3.73 08:00–09:00 5.14 09:00–10:00 5.91 10:00–11:00 6.00 11:00–12:00 5.70 12:00–13:00 5.49 13:00–14:00 5.56 14:00–15:00 5.83 15:00–16:00 6.35 16:00–17:00 6.65 17:00–18:00 6.25 18:00–19:00 6.20 19:00–20:00 6.30 20:00–21:00 6.07 21:00–22:00 4.80 22:00–23:00 3.44 23:00–24:00 2.15
Figure 4: Diurnal standards of Internet usage in Australia and the U.S. West Coast compared to the ideal load.
Distribution of Web users in the world
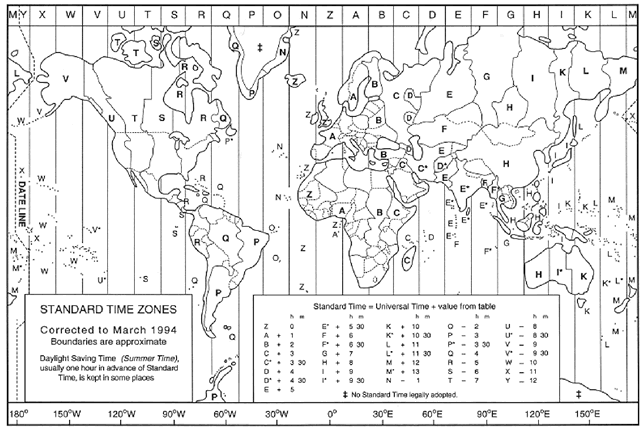
Given the observed diurnal variations in human activity patterns, it follows that a Web site which possesses a purely national audience will have a demand curve that resembles the standard diurnal pattern. A site with a truly international audience, therefore, should have a flat curve, caused by superimposing the diurnal curves for all individual world time zones. Such a totally horizontal curve is hypothetical only, however, because the World’s population is not evenly spread across the time zones, with the Pacific Ocean being the most obvious and prominent deviation (Figure 5).
Figure 5: Map of the world showing time zones (Hong Kong Observatory, at http://www.hko.gov.hk/gts/time/clock/clockA.htm).
To arrive at an accurate picture, the distribution of Web users per time zone was calculated drawing on country–specific demographic data and Web user estimates. The total world population estimate as of July 2003 has been culled from the CIA World Factbook 2003 (CIA, 2003). The latter source also served for the estimate of the population of Web users. The CIA Handbook, however, does not provide estimates of Web users for some countries/domains, which are represented in the logs of the Marshall Islands site. For some of these, such as Guernsey or the Isle of Man, the United Kingdom percentage was applied, while for others small ‘token’ numbers of 1,000 or less were estimated. Table 3 (see end of paper) sets out these data. The countries of the world were regrouped into the world’s time zones, using Coordinated Universal Time (UTC). The time zone information was culled from SwissInfo (2003).
The estimated number of Web users in countries which stretch multiple time zones, i.e. Australia (3), Brazil (3), Canada (6), Indonesia (3), Mexico (3), Russia (10), and the U.S. (6), was proportionally allocated to the time zones they span, based on the actual total human population distribution per time zone within the country. It is acknowledged that the distribution of Internet access in countries such as Russia, Indonesia or Brazil, may not be uniformly distributed, but be concentrated in population centres. It is impossible at this time to develop a more detailed approach that would remove any ambiguities, not matter how small they are deemed to be at present.
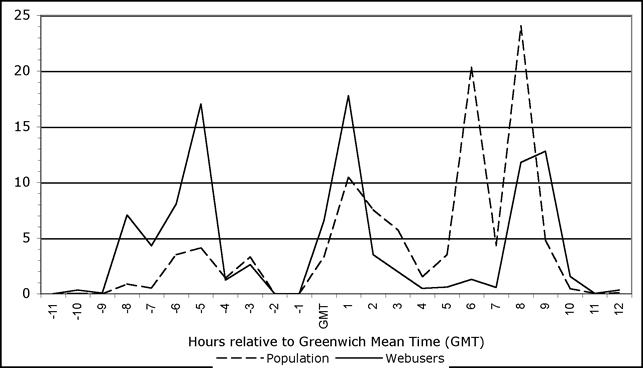
What becomes obvious from a perusal of Figure 6 is that the relative proportion of Web users across the globe is distributed quite differently from the population. This is not surprising, given the socio–economic differential between the developed countries in North America, Europe and Australia on the one hand, and the populous regions of South–East Asia and China on the other.
Figure 6: World–wide distribution of Internet users compared to the total population arranged by time zones.
The matter is complicated by that fact that not all Web users are English–speaking. While in the early days of the World Wide Web the fear had been expressed that English would dominate the Web at the expense of small linguistic groups (cf. Spennemann, et al., 1996), the development of the Web and the concomitant development of graphics–based personal computers has seen a multitude of languages being used on the Internet, some of them using different character sets such as Japanese, Chinese and Arabic or Russian. While English is one of the most widely understood languages, one cannot readily extrapolate from the number of Web users in the world to the number of English–speaking Web users. While there are tables detailing the languages spoken in the countries of the world, there is no compilation that sets out the percentage of people in a given country that either speaks or at least understands English.
For the Web user community limited estimates were published by Global Reach (2003, see for methodology and references; see also OCOL, 2002). In the absence of reliable and accessible data, a new estimate was compiled for this study based on the languages spoken in each country. Where English is spoken as an official language it was assumed that 95 percent of the population had the language ability to read or use English–language Web sites, taking into account a small minority of non–English speaking immigrants. Where English was listed as a second language or as a language widely spoken, a value of 50 percent was used, while a value of 33.3 percent was used for countries where English is deemed as widely understood. Those countries where English is learned as a foreign language, were split into countries with a well–developed Western–oriented education system (with English–language proficiency set at 15 percent) and the remaining countries for which a proficiency of five percent was assumed. Japan and China were set at five percent while South Korea was set at 15 percent.
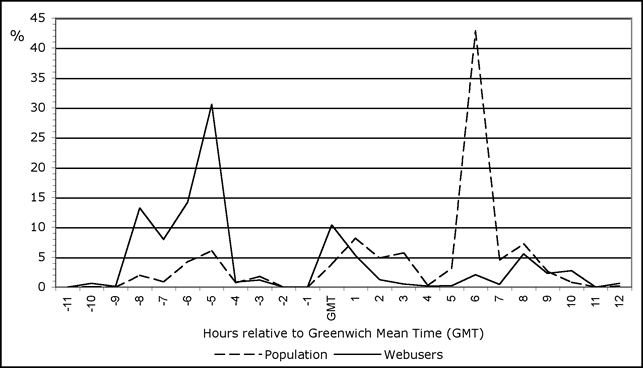
It is obvious that such arbitrary figures are not a reflection of the true distribution, but only an approximation. It is probable that the five percent estimates for many of the developing countries are an underestimate. The distribution of English–proficient Web users against populations proficient in English (Figure 7) is even more skewed than the previous comparison on the basis of total population.
Figure 7: World–wide distribution of people proficient in English compared to English–proficient Web users (see text).
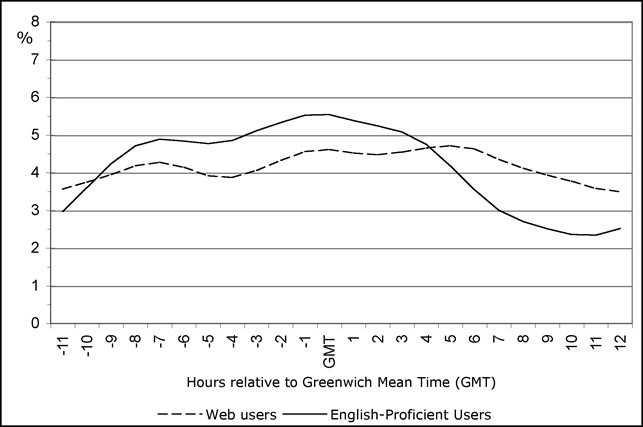
These graphs, however, cannot be taken at face value for comparison with Web demand of a given site. As the Internet usage for each country follows the diurnal pattern set out earlier, these figures need to be modulated. For this reason, the potential Web users for each time zone were distributed in percent according to the diurnal standard set out in Figure 4. This results in the modulated demand curves shown in Figure 8. Table 2 provides the raw data set to permit the reader a comparison with their own Web site demand curves.
Figure 8: World–wide distribution of Internet users compared to English–proficient Web users modulated for diurnal variations of usage.
Table 2: Web usage — Web usage Standard for all time zones combined.
GMT Total Web users English–proficient
Web users-11 3.57 2.97 -10 3.75 3.60 -9 3.95 4.24 -8 4.18 4.71 -7 4.27 4.89 -6 4.14 4.83 -5 3.92 4.77 -4 3.88 4.86 -3 4.05 5.11 -2 4.33 5.33 -1 4.56 5.52 GMT 4.61 5.54 1 4.52 5.38 2 4.48 5.24 3 4.54 5.08 4 4.65 4.75 5 4.71 4.18 6 4.63 3.55 7 4.35 3.01 8 4.12 2.70 9 3.94 2.51 10 3.78 2.36 11 3.58 2.34 12 3.49 2.52
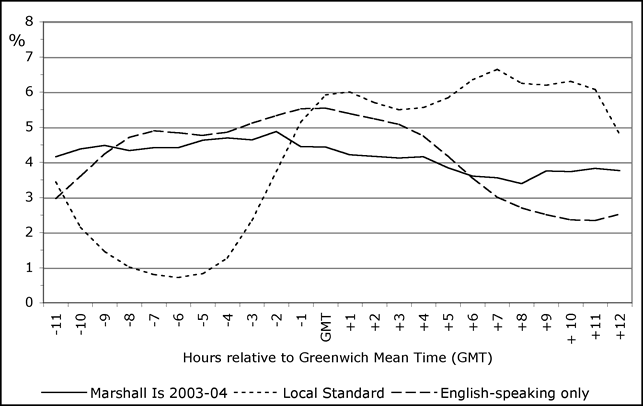
Figure 9: Comparison of the usage of the Marshall Islands site (2003–May 2004) with the Australian Web standard and the world standard English–speaking Web users.
Finally, how does the demand curve for the Marshall Islands site, which started this investigation, stack up? Figure 9 shows the demand curve for the Marshall Islands site (average January 2003 to May 2004) compared to the Australian Web standard and compared to the international Web standard of English–speaking Web users. Clearly, the demand curve for the Marshall Islands site does not conform at all to the national Australian curve, demonstrating a much more international appeal of the site. Yet while the demand curve follows the international Web standard in general terms, it does not follow it closely: it is too flat. Looking at the time zone distribution in relation to GMT, this suggests that the site has a higher than standard appeal in the Australia–Pacific region, a slightly lower than standard appeal in the U.S. and a lower that standard appeal in the South–East Asian region. Given the regional thematic focus of the site, dealing with a small Pacific Island nation, this distribution pattern is to be expected.
Table 3 : Population, number of Web users and estimated English–language proficiency per country
Land
Time Zone
UTC
Population
Estimated Web users
Percentage English–Speaking
Estimated English–proficient Web users
Afghanistan *
4.5
28717213
200
5
10
Albania
1
3582205
12000
5
600
Algeria
1
32818500
180000
5
9000
American Samoa *
-11
70260
1000
95
950
Andorra
1
69150
24500
5
1225
Angola
1
10766471
60000
5
3000
Anguilla
-4
12738
919
33
303
Antigua and Barbuda
-4
67897
5000
95
4750
Argentina
-3
38740807
3880000
50
1940000
Armenia
4
3326448
30000
5
1500
Aruba
-4
70844
24000
5
1200
Australia EST
10
1745365
940262
95
893249
Australia CST
9.5
16060997
8652369
95
8219751
Australia WST
8
1925622
1037370
95
985502
Austria
1
8188207
3700000
15
555000
Azerbaijan
4
7830764
25000
5
1250
Bahamas
-5
297477
16900
95
16055
Bahrain
3
667238
140200
50
70100
Bangladesh
6
138448210
150000
50
75000
Barbados
-4
277264
6000
95
5700
Belarus
3
10322151
422000
5
21100
Belgium
1
10289088
3760000
15
564000
Belize
-6
266440
18000
95
17100
Benin
1
7041490
25000
5
1250
Bermuda
-2
64482
25000
95
23750
Bhutan
6
2139549
2500
5
125
Bolivia
-4
8586443
78000
5
3900
Bosnia–Herzegovina
1
3989018
45000
5
2250
Botswana
2
1573267
33000
95
31350
Brazil — Andes
-5
589810
45297
15
6795
Brazil — Western
-4
16176261
1242328
15
186349
Brazil — Eastern
-3
165266534
12692375
15
1903856
British Virgin Islands *
-4
21730
1000
95
950
Brunei
8
358098
35000
50
17500
Bulgaria
2
7537929
585000
5
29250
Burkina
0
13228460
25000
5
1250
Burma
6.5
42510537
10000
5
500
Burundi
2
6096156
6000
5
300
Cambodia
7
13124764
10000
50
5000
Cameroon
1
15746179
45000
95
42750
Canada — Pacific
-8
4228780
2211084
95
2100530
Canada — Mountain
-7
3235934
1691959
95
1607361
Canada — Central
-6
2254368
1178732
95
1119795
Canada — Eastern
-5
20032559
10474341
95
9950624
Canada — Atlantic
-4
1904476
995786
95
945997
Canada — Newfoundland
-3.5
550996
288097
95
273692
Cape Verde
-1
412137
12000
5
600
Cayman Islands *
-5
41934
5000
95
4750
Central African Republic
1
3683538
2000
5
100
Chad
1
9253493
4000
5
200
Chile
-4
15665216
3100000
15
465000
China
8
1286975468
45800000
5
2290000
Christmas Island (Indian Ocean) *
7
433
0
95
0
Cocos Islands (Indian Ocean) *
6.5
630
0
95
0
Colombia
-5
41662073
1150000
5
57500
Comoro Islands
3
632948
2500
5
125
Congo, Dem. Rep. of the
1
56625039
6000
5
300
Congo, Rep. of the
1
2954258
500
5
25
Cook Islands *
-10
21008
1000
50
500
Costa Rica
-6
3896092
384000
5
19200
Cote d’Ivoire
0
16962491
70000
5
3500
Croatia
1
4422248
480000
15
72000
Cuba
-5
11263429
120000
5
6000
Cyprus
2
771657
150000
33.3
49950
Czech Republic
1
10249216
2690000
5
134500
Denmark
1
5384384
3370000
15
505500
Djibouti
3
457130
3300
5
165
Dominica
-4
69655
2000
95
1900
Dominican Republic
-4
8715602
186000
33.3
61938
East Timor *
9
997853
200
50
100
Ecuador
-5
13710234
328000
5
16400
Egypt
2
74718797
600000
15
90000
El Salvador
-6
6470379
40000
5
2000
Equatorial Guinea
1
510473
900
5
45
Eritrea
3
4362254
10000
5
500
Estonia
2
1408556
429700
50
214850
Ethiopia
3
66557553
20000
50
10000
Falkland Islands *
-4
2967
100
50
50
Faroe Islands
0
46345
3000
5
150
Fiji
12
868531
15000
95
14250
Finland
2
5190785
2690000
15
403500
France
1
60180529
16970000
15
2545500
French Guyana
-3
186917
2000
5
100
French Polynesia
-10
262125
16000
5
800
Gabon
1
1321560
18000
5
900
Gambia
0
1501050
5000
95
4750
Georgia
4
4934413
25000
5
1250
Germany
1
82398326
32100000
15
4815000
Ghana
0
20467747
200000
95
190000
Gibraltar *
1
27776
5000
95
4750
Greece
2
10665989
1400000
5
70000
Greenland
-2
56385
20000
5
1000
Grenada
-4
89258
5200
95
4940
Guadeloupe
-4
440189
4000
5
200
Guam
10
163941
5000
95
4750
Guatemala
-6
13909384
200000
5
10000
Guernsey *
0
64818
36946
95
35099
Guinea
0
9030220
15000
5
750
Guinea Bissau
0
1360827
4000
5
200
Guyana
-3
702100
95000
95
90250
Haiti
-5
7527817
30000
5
1500
Honduras *
-6
6669789
1000
33.3
333
Hong Kong
8
7394170
4350000
66
2871000
Hungary
1
10045407
1200000
50
600000
Iceland
0
280798
220000
15
33000
India
5.5
1049700118
7000000
95
6650000
Indonesia — Eastern
9
101085273
1893519
50
946760
Indonesia — Central
8
76342801
1430045
50
715023
Indonesia — Western
7
57465379
1076436
50
538218
Iran
3.5
68278826
1326000
5
66300
Iraq
3
24683313
12500
5
625
Ireland
0
3924140
1310000
95
1244500
Israel
2
6116533
1940000
33
640200
Italy
1
57998353
19250000
15
2887500
Jamaica
-5
2695867
100000
95
95000
Jan Mayen Island *
1
90156
1000
5
50
Japan
9
127214499
56000000
5
2800000
Jordan
2
5460265
212000
33
69960
Kazakhstan
5
16763795
100000
5
5000
Kenya
3
31639091
500000
95
475000
Kiribati
12
98549
1000
95
950
Korea, North *
9
22466481
500
5
25
Korea, South
9
48289037
25600000
5
1280000
Kuwait
3
2183161
200000
50
100000
Kyrgystan
6
4892808
51600
5
2580
Laos
7
5921545
10000
50
5000
Latvia
2
2348784
312000
5
15600
Lebanon
2
3727703
300000
50
150000
Lesotho
2
1861959
5000
95
4750
Liberia
0
3317176
500
95
475
Libya
1
5499074
20000
33.3
6660
Liechtenstein FL *
1
33145
5000
15
750
Lithuania
1
3592561
341000
5
17050
Luxembourg
1
454157
100000
15
15000
Macao
8
2063122
100000
33.3
33300
Macedonia
1
469903
101000
5
5050
Madagascar
3
16979744
35000
5
1750
Malawi
2
11651239
35000
95
33250
Malaysia
8
23092940
5700000
95
5415000
Maldives
4
329684
6000
50
3000
Mali
0
11626219
30000
5
1500
Malta
1
400420
59000
95
56050
Man, Isle of *
0
74261
42329
95
40212
Mariana Islands *
10
80006
1000
95
950
Marshall Islands
12
56429
900
95
855
Martinique
-4
425966
5000
5
250
Mauritania
0
2912584
7500
5
375
Mauritius
4
1210447
158000
50
79000
Mayotte (France) *
3
178437
2000
5
100
Mexico
-8
2680513
89429
15
13414
Mexico
-7
9847657
328543
15
49281
Mexico
-6
92379821
3082028
15
462304
Micronesia, Federated States of
-11
108143
2000
95
1900
Moldova
2
4439502
15000
5
750
Monaco *
1
32130
15000
50
7500
Mongolia
8
2712315
40000
5
2000
Montserrat *
-4
8995
500
95
475
Morocco
0
31689265
400000
5
20000
Mozambique
2
17479266
22500
5
1125
Namibia
2
1927447
45000
95
42750
Nauru *
12
12570
200
95
190
Nepal
5.75
26469569
60000
5
3000
Netherlands
1
16150511
9730000
15
1459500
Netherlands Antilles
-4
216226
2000
5
100
New Caledonia
11
210798
24000
5
1200
New Zealand
12
3951307
2060000
95
1957000
Nicaragua
-6
5128517
20000
5
1000
Niger
1
11058590
12000
5
600
Nigeria
1
133881703
100000
95
95000
Niue Island *
-11
2145
100
95
95
Norfolk Island (Pacific) *
11.5
1853
999
50
499
Norway
1
4546123
2680000
15
402000
Occupied Palestinian Territory
2
3512062
120000
5
6000
Oman
4
2807125
120000
50
60000
Pakistan
5
150694740
1200000
50
600000
Palau *
9
19717
500
95
475
Panama
-5
2960784
45000
33.3
14985
Papua New Guinea
10
5295816
135000
50
67500
Paraguay
-4
6036900
20000
5
1000
Peru
-5
28409897
3000000
5
150000
Philippines
8
84619974
4500000
50
2250000
Pitcairn Island *
-9
47
0
95
0
Poland
2
38622660
6400000
5
320000
Portugal
0
10102022
4400000
5
220000
Puerto Rico
-4
3885877
600000
95
570000
Qatar
3
817052
75000
33.3
24975
Reunion (France)
4
755171
10000
5
500
Romania
2
22271839
1000000
5
50000
Russia Zone 1
2
918783
114430
5
5722
Russia Zone 2
3
88512805
11023812
5
551191
Russia Zone 3
4
4758516
592649
5
29632
Russia Zone 4
5
21176372
2637408
5
131870
Russia Zone 5
6
7540003
939068
5
46953
Russia Zone 6
7
8604363
1071629
5
53581
Russia Zone 7
8
3644369
453887
5
22694
Russia Zone 8
9
3434447
427743
5
21387
Russia Zone 9
10
4307228
536443
5
26822
Russia Zone 10
11
1183539
147404
5
7370
Russia Zone 11
12
445853
55529
5
2776
Rwanda
2
7810056
20000
95
19000
Samoa (Western)
-11
178173
3000
95
2850
San Marino
1
28119
9000
5
450
Sao Tome and Principe
0
175883
1453000
5
72650
Saudi Arabia
3
24293844
100000
33.3
33300
Senegal
0
10580307
400000
5
20000
Serbia and Montenegro *
1
10655774
20000
15
3000
Seychelles
4
80469
9000
95
8550
Sierra Leone
0
5732681
20000
95
19000
Singapore
8
4608595
2310000
95
2194500
Slovakia
1
5430033
700000
5
35000
Slovenia
1
1935677
600000
5
30000
Solomon Islands
11
509190
8400
50
4200
Somalia
3
8025190
200
50
100
South Africa
2
42768678
3068000
50
1534000
Spain
1
40217413
7890000
15
1183500
Sri Lanka
5.5
19742439
121500
50
60750
St Helena Island *
0
7367
500
95
475
St Kitts–Nevis
-4
38763
2000
95
1900
St Lucia
-4
162157
3000
95
2850
St Pierre/Miquelon *
-3
6976
200
5
10
St Vincent
-4
116812
3500
95
3325
Sudan
2
38114160
56000
50
28000
Surinam
-3
435449
14500
33.3
4829
Swaziland
2
1161219
7000
95
6650
Sweden
1
8878085
6020000
15
903000
Switzerland
1
7318638
3850000
15
577500
Syria
2
17585540
60000
33.3
19980
Taiwan
8
22603001
11600000
15
1740000
Tajikistan
6
6863752
5000
5
250
Tanzania
3
35922454
300000
95
285000
Thailand
7
64265276
1200000
50
600000
Togo
0
5429299
50000
5
2500
Tokelau *
-11
1418
0
50
0
Tonga
12
108141
1000
50
500
Trinidad and Tobago
-4
1104209
120000
95
114000
Tunisia
1
9924742
400000
5
20000
Turkey
2
68109469
2500000
5
125000
Turkmenistan
5
4775544
2000
5
100
Turks and Caicos Islands *
-5
19350
1000
95
950
Tuvalu *
12
11305
200
50
100
Uganda
3
25632794
60000
95
57000
Ukraine
2
48055439
750000
5
37500
United Arab Emirates
4
2484818
900000
33.3
299700
United Kingdom
0
60094648
34300000
95
32585000
Uruguay
-3
3413329
400000
5
20000
U.S. — Hawaii
-10
1249902
713541
95
677864
U.S. — Alaska
-9
646771
369227
95
350766
U.S. — Pacific
-8
47952694
27375109
95
26006353
U.S. — Mountain
-7
18558592
10594681
95
10064947
U.S. — Central
-6
91264707
52100958
95
49495910
U.S. — Eastern
-5
130669888
74596485
95
70866661
Uzbekistan
6
25981647
100000
5
5000
Vanuatu
11
199414
3000
80
2400
Vatican City
1
911
40000
5
2000
Venezuela
-4
24654694
1300000
5
65000
Vietnam
7
81624716
400000
50
200000
Virgin Islands
-4
124778
12000
50
6000
Wallis Island *
12
15734
200
5
10
Western Sahara *
0
261794
500
5
25
Yemen
3
19349881
17000
5
850
Zambia
2
10307333
25000
95
23750
Zimbabwe
2
12576742
100000
95
95000
About the author
Dirk H.R Spennemann is Associate Professor in Cultural Heritage Management at Charles Sturt University ( http://www.csu.edu.au/) in Australia. His main research interests are German colonial heritage in Oceania, in particular Micronesia, and historic preservation issues in Micronesia in general. The second plank of his research deals with the utilization of information technology for the benefit of tertiary and public education. He is also the general editor of Digital Micronesia ( http://marshall.csu.edu.au/).
E–mail: dspennemann [at] csu [dot] edu [dot] au
Acknowledgments
In am indebted to a number of individuals who provided data for the study: Robert Ayre (Team Telstra, Australia); Graham Browne (Country Energy, Albury); Robert Hay (Division of Information Technology, Charles Sturt University); Randol Tigrett (Pacwest, U.S.); and, Ross Wheeler (Albury Internet, Albury).
I am further indebted to a number of anonymous referees for First Monday who made constructive comments on the paper.
References
CIA, 2003. CIA Factbook, at http://www.cia.gov/cia/publications/factbook/, accessed 6 December 2006.
Global Reach, 2003. “Details of country/language analysis,” at http://www.global-reach.biz/globstats/details.html, accessed 6 December 2006.
OCOL (Canada. Office of the Commissioner of Official Languages), 2002. “Special Study. Official Languages On The Internet,” at http://www.ocol-clo.gc.ca/archives/sst_es/2002/lang_internet/lang_internet_2002_e.htm, accessed 6 December 2006.
Eric T. Peterson, 2005. Web Site Measurement Hacks: Tips and Tools to Help Optimize Your Online Business. Sebastopol, Calif.: O’Reilly.
Eric T. Peterson, 2004. Web Analytics Demystified: A Marketer’s Guide to Understanding How Your Web Site Affects Your Business.Portland, Ore.: Celilo Group Media.
Dirk H.R. Spennemann, 2004. “A Digital library and archive about the Marshall Islands: Experiences and challenges,” Australian Library Journal, volume 53, number 3. at http://alia.org.au/publishing/alj/53.3/full.text/spennemann.html, accessed 6 December 2006.
Dirk H.R. Spennemann, Jim Birckhead, David G. Green, and John S. Atkinson, 1996. “The electronic colonisation of the Pacific,” Computer Mediated Communications Magazine, volume 3, number 2, at http://www.december.com/cmc/mag/1996/feb/spen.html, accessed 6 December 2006.
SwissInfo, 2003, “Local times around the world,” at http://swissinfo.net/cgi/worldtime/, accessed 6 December 2006.
Editorial history
Paper received 2 October 2005; accepted 4 November 2005.

This work is licensed under a Creative Commons Developing Nations license.Just how international is my Web site? Estimating reach through analysis of hourly demand by Dirk H.R. Spennemann
First Monday, volume 10, number 12 (December 2005),
URL: http://firstmonday.org/issues/issue10_12/spennemann/index.html